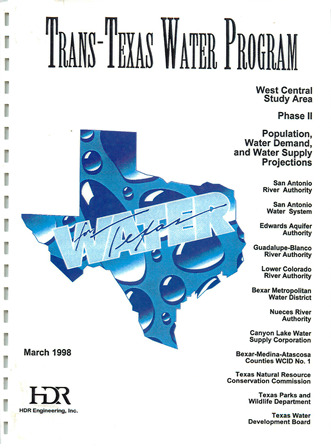
Trans-Texas Water Program West Central Study Area Phase II Population, Water Demand and Water Supply Projections

| Author | HDR Engineering, Inc, San Antonio River Authority, San Antonio Water System, Edwards Aquifer Authority, Guadalupe-Blanco River Authority, Lower Colorado River Authority, Bexar Metropolitan Water District, Nueces River Authority, Canyon Lake Water Supply |
| Year | 1998 |
| Description | Projections for population and water demand from 1990-2050 for the 1998 Trans-Texas Water Program West Central Study Area Phase II Note: This report is included for its historical value but has been replaced by more recent studies. |
| Publisher | HDR Engineering, Inc |
| Location | Trans-Texas Water Program West Central Study Area |
| Cover | View Download |
| File | View Download |
| Summary |
|
Note: This report is included for its possible historical value but has been replaced by the Texas Water Plan. The objectives of this West Central Trans-Texas Study are as follows: 1. Present the TWDB 1996 consensus water planning population and water demand projections for the 32-county West Central study area, plus seven additional Nueces Basin counties. The projections will be tabulated by county and city within county for the following subareas of the West Central Study Area: (1) The Edwards Aquifer Authority Area, and (2) the Nueces, San Antonio, Guadalupe and Lower Colorado River Basin areas, respectively. For study areas of Bexar, Comal, and Guadalupe Counties, and the Mid-Cities area, projections of “West Central Study Area Phase 2 Report Letter of Intent Analysis,” San Antonio River Authority, et al, San Antonio, Texas, October, 1996, will be used. Projections will be shown in ten-year intervals starting in 1990 and ending in 2050. Population will be in numbers of people, and water demand projections will be in acre-feet per year for water use categories: (1) municipal, (2) industrial, (3) steam electric power general, (4) irrigation, (5) mining, ( 6) livestock, and (7) total water demand. 2. Using water supply information contained in the West Central Trans-Texas Phase I studies, water supply information of the 32-county West Central Trans-Texas study area will be tabulated for: ( 1) study area counties listed in objective 1, with counties and parts of counties and cities grouped by river basin subareas for the Nueces, San Antonio, Guadalupe, and Lower Colorado River Basin areas, the Brazos-Colorado, Colorado-Lavaca, Lavaca-Guadalupe, and San Antonio-Nueces Coastal Basin areas, study area counties and parts of counties of the adjacent Brazos and Lavaca Basins; and (2) cities of Bexar, Medina, Uvalde, and parts of Comal, Hays, Guadalupe, and Caldwell Counties located within the Edwards Aquifer Authority regional demand center. Projections will be shown in 10-year intervals starting in 1990 and ending in 2050. 3. Using results of objectives 1 and 2, water demand and water supply projections will be presented in tabular and graphic form, by decade from 1990 through 2050 for the counties, cities, river basins, and Edwards Aquifer Authority areas listed in objectives 1 and 2 above. The summaries will show surpluses and shortages for the water demand and water supply areas and centers. The projections listed in the objectives will be based upon the following conditions, assumptions, and data: A. The TWDB 1996 consensus water planning projections to be used are as follows: 1. Most likely population; 2. Most likely municipal water demand for below normal precipitation and advanced conservation; 3. Base oil prices, with conservation for manufacturing; 4. Series 3 irrigation (aggressive adoption of irrigation technology and a reduction in Federal Farm Programs by one-half); 5. Steam-Electric power high series; 6. Mining- TWDB only series; 7. Livestock-TWDB only series. B. Assume 450,000 acft/yr pumpage from the Edwards Aquifer for years 1997 through 2007, and 400,000 acft/yr beginning in year 2008. C. Texas Water Development Board (TWDB) groundwater information for counties of the study area. D. The quantity of water supply from the Edwards Aquifer will be based on provisions of SB 1477, with pumpage set at 450,000 acft/yr for the period 1997 through 2007, and 400,000 acft/yr beginning in 2008, and the assumption that each entity which obtained water from the Edwards Aquifer in 1990 will have its 1990 pro rata share of Edwards pumpage in future years. E. The quantity of surface water supply from reservoirs of the study area will be the firm yield of each respective reservoir, as determined by previous studies, and in accordance with water rights permits issued by the Texas Natural Resource Conservation Commission (TNRCC). F. The quantity of dependable surface water supplies from run-of-river water rights permits will be calculated for study area counties of the Nueces and Guadalupe-San Antonio River Basins using the existing Nueces and Guadalupe-San Antonio River Basin models developed by HDR Engineering, lnc. These computations will be based upon Edwards Aquifer pumpage of 400,000 acft/yr. Dependable supplies of surface water from run-of-river permits for counties of the Lower Colorado River Basin will be tabulated from computer model results that were prepared by the Lower Colorado River Authority for use in the North Central Trans-Texas (NCTT) study. |
Search for Documents
Advance Search
Explore EAA's Scientific Reports
- All Reports
- Water Resources Planning and Management
- Floods and Drought
- Water Quality
- Climatology
- Surface Water / Groundwater Relationship
- Biology
- Springs, Groundwater Discharge
- Archaeology
- RZ Protection
- Aquifer Levels
- Remote Sensing
- Precipitation
- Overview Studies
- Modeling
- Hydrology and Hydrogeology
- History
- Groundwater Recharge, Recharge Zone
- Groundwater Movement
- Geomorphology and Caves
- Weather Modification
- Geology
- Water Use and Conservation
- Geochemistry
