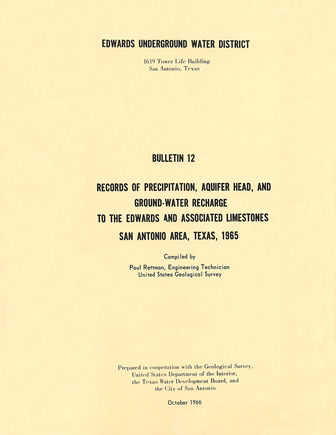
Records of Precipitation, Aquifer Head, and Ground-Water Recharge to the Edwards and Associated Limestones, San Antonio Area, Texas, 1965

| Author | Rettman P (US Geological Survey) |
| Year | 1966 |
| Description | Annual report for 1965 on precipitation, aquifer levels, and recharge to the Edwards Aquifer issued by the Edwards Underground Water District |
| Report Number | Bulletin 12 |
| Publisher | Edwards Underground Water District |
| Location | Edwards Aquifer Balcones Fault Zone San Antonio Segment |
| Cover | View Download |
| File | View Download |
| Summary |
|
The Edwards and associated limestones, the principal aquifer in the San Antonio area, has been the subject of numerous geologic and hydrologic reports. Records of precipitation, water levels, and estimates of recharge to the aquifer during 1965 are summarized in this report, which is one of three basic-data reports published yearly by the Edwards Underground Water District. The gathering of these records (and data) is part of the continuing hydrologic investigation by the U. S. Geological Survey in cooperation with the Edwards Underground Water District, the Texas Water Development Board, and the city of San Antonio. Table 1 shows the annual precipitation at selected stations throughout the San Antonio area for 1965 and the annual average for each of these stations. Rainfall was slightly above average in the western part of the area to moderately heavy in the eastern part of the area. The recorded high and low water levels during 1965 in five selected key wells are shown in table 2. In 1965, the water levels fluctuated above the midpoint between the record high and low levels which are also shown in table 2. Because of the above-average rainfall in 1965, the aquifer head in the eastern part of the aquifer increased to levels generally higher than those of 1962 and 1963 (Garza, 1963, p. 4; Garza, 1964, p. 3). Recharge to the Edwards and associated limestones is chiefly from streams that lose most of their base flow and a part of their flood flow as they cross the Balcones fault zone on the outcrop of the aquifer. The recharge is estimated from records of continuous discharge at gaging stations located above and below the infiltration areas in each of most of the streams . The monthly mean discharges at the gaging stations during October-December 1965 are shown in table 3. Streamflow records for January-September 1965 have been published by the U.S. Geological Survey (U. S. Department of the Interior, Geological Survey, Water Resources Division, 1965). Table 4 shows the recharge in each basin of the San Antonio area for 1965 and the average annual recharge for the period 1934-64. The recharge estimates for 1934- 64 were taken from an open-file report (to be published by the Texas Water Development Board) on the 1960- 64 studies of the Edwards and associated limestones by Sergio Garza. The basic methods employed by Petitt and George (1956) and by Garza (1962; open- file report) were used for estimating the 1965 recharge, which was well above the annual average. During 1965, the basin areas of Cibolo and Dry Comal Creeks received over 18 percent of the total recharge, and nearly 38 percent of this total took place during the May-June floods. |
Search for Documents
Advance Search
Explore EAA's Scientific Reports
- All Reports
- Overview Studies
- Modeling
- Hydrology and Hydrogeology
- History
- Groundwater Recharge, Recharge Zone
- Groundwater Movement
- Geomorphology and Caves
- Weather Modification
- Geology
- Water Use and Conservation
- Geochemistry
- Water Resources Planning and Management
- Floods and Drought
- Water Quality
- Climatology
- Surface Water / Groundwater Relationship
- Biology
- Springs, Groundwater Discharge
- Archaeology
- RZ Protection
- Aquifer Levels
- Remote Sensing
- Precipitation
