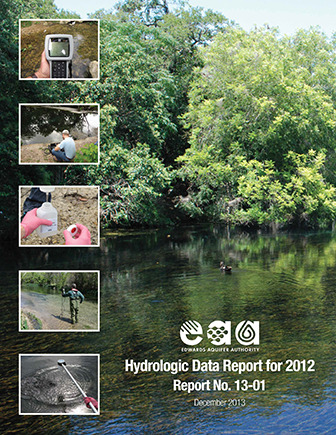
Edwards Aquifer Authority Hydrologic Data Report for 2012 / Report No. 13-01

| Author | RL Tremallo, JM Hamilton, S Johnson, R Esquilin, C Burgoon, G Luevano, D Gregory, J Mireles, R Gloyd, and GM Schindel |
| Year | 2013 |
| Description | Annual report for 2012 on recharge, discharge, precipitation, water levels and water quality in the Edwards Aquifer Balcones Fault Zone San Antonio Segment |
| Report Number | 13-01 |
| Publisher | Edwards Aquifer Authority |
| Location | Edwards Aquifer Balcones Fault Zone San Antonio Segment |
| Cover | View Download |
| File | View Download |
| Summary |
|
This report presents results of the Edwards Aquifer Authority’s (EAA’s) Edwards Aquifer Data Collection Program for calendar year 2012. During 2012, the EAA collected a wide variety of Edwards Aquifer data, including Water levels at the Bexar County (J-17) index wellwere below the historical mean for the entire year. The maximum level of 666.8 feet above msl at J-17 occurred during March, and the low of 637.6 feet above msl occurred in August. Other wells in the region exhibited similar behavior with regard to lower than normal water levels. The Comal County observation well had an annual high water level slightly above the historical mean high. However, for most of the year, this well also exhibited lower than normal water levels. In 2012, rainfall amounts were above the mean in Bexar, Comal, and Hays counties and below the mean in Medina and Uvalde counties. In general, the region received between 60 and 129 percent of normal precipitation during the year, with the west receiving the lower rainfall totals and the east receiving the higher rainfall totals. Total estimated recharge to the Edwards Aquifer was below normal in 2012. Recharge for the year was estimated at 313,500 acre-feet, compared with the period-of-record (1934–2012) median annual recharge value of 556,900 acre-feet. Recharge in 2012 was below the period-of-record median value for all basins, except for the Blanco River Basin, which was above the median. In calendar year 2012, total groundwater discharge from the Edwards Aquifer through wells and springs was estimated at 687,033 acre-feet. This amount is below the median total discharge of 692,900 acre-feet for the period of record (1934–2012). Discharge from wells in 2012 was estimated to be 384,685 acre-feet, approximately 56,885 acre-feet above the 327,800 acre-foot period of record (1934–2012) median. The lowest annual estimated discharge from wells for the period of record was 101,900 acre-feet in 1934, and the highest was 542,400 acre-feet in 1989. Discharge from springs in 2012 was estimated at 302,348 acre-feet, somewhat below the period of record median of 379,900 acre-feet. The lowest annual discharge from springs for the period of record (1934–2012) was 69,800 acre-feet in 1956, and the highest was 802,800 acre-feet in 1992. Spring discharge in 2012 was the fifteenth lowest discharge on record. In 2012, the EAA collected water quality samples from 95 wells (some wells sampled multiple times), 12 streams (some sampled in more than one location), and five spring groups. Samples collected for the year are summarized below by sample type and location. Sample-Collection Summary, Calendar Year 2012 Bacteria Samples Metals Samples Nitrate-Nitrite as Nitrogen Volatile Organic Compounds Semivolatile Organic Compounds Pesticide and/or Herbicide Compounds Polychlorinated Bi-Phenyls Pharmaceuticals and Personal Care Products In calendar year 2012, seven sanitary sewer system overflows occurred in Bexar County, the volume of one of which was considered significant, one moderate, three minor, and two negligible. The significant overflow occurred in October, the moderate in March, and the remaining five in April, May, September, and December (two). The largest overflow, approximately 111,350 gallons, occurred between October 14 and 15 east of Bulverde Road near the Santa Lucia and Montebello Road intersection in northern Bexar County. The moderate overflow, approximately 84,500 gallons, occurred on or about March 7 near Cloud Top Road, west of Blanco Road in northern Bexar County. The remaining overflows, which ranged between approximately 1,500 and 17,500 gallons per event, occurred between IH-10 to the west, and U.S. 281 to the east, both north and south of Loop 1604. The EAA responded to each event, taking a series of samples for the major and moderate events to determine whether a bacterial plume could be detected in the Edwards Aquifer. |
Search for Documents
Advance Search
Explore EAA's Scientific Reports
- All Reports
- Water Use and Conservation
- Geochemistry
- Water Resources Planning and Management
- Floods and Drought
- Water Quality
- Climatology
- Surface Water / Groundwater Relationship
- Biology
- Springs, Groundwater Discharge
- Archaeology
- RZ Protection
- Aquifer Levels
- Remote Sensing
- Precipitation
- Overview Studies
- Modeling
- Hydrology and Hydrogeology
- History
- Groundwater Recharge, Recharge Zone
- Groundwater Movement
- Geomorphology and Caves
- Weather Modification
- Geology
