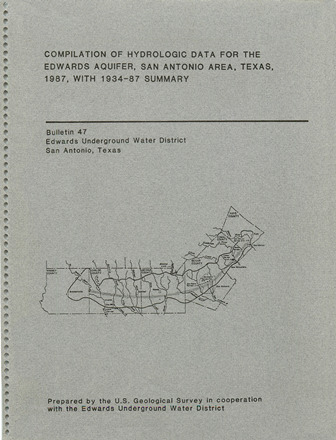
1987 Hydrologic Data Report – Compilation of Hydrologic Data for the Edwards Aquifer, San Antonio Area, Texas, 1987, with 1934-87 Summary

| Author | Nalley GM and Rettman PL (US Geological Survey) |
| Year | 1988 |
| Description | Annual report for 1987 on recharge, discharge, water levels and water quality in the Edwards Aquifer San Antonio Region. Note: Large-format versions of the plates for this report are available Here |
| Report Number | Bulletin 47 |
| Publisher | Edwards Underground Water District |
| Location | Edwards Aquifer - San Antonio Area |
| Cover | View Download |
| File | View Download |
| Summary |
|
The average estimated annual ground-water recharge to the Edwards aquifer in the San Antonio area, Texas, from 1934 through 1987 was 640,600 acre-feet. Recharge in 1987 was 2,003,600 acre-feet, which is the highest estimated annual recharge since 1934. The previous maximum annual recharge of 1,711,200 acre-feet occurred in 1958, and a minimum annual recharge of 43,700 acre-feet occurred in 1956. The calculated annual discharge from the Edwards aquifer by wells and springs in 1987 was 940,400 acre-feet, which is the second highest calculated annual discharge since 1934. Annual discharge by wells and springs ranged from a maximum of 960,900 acre-feet in 1977 to a minimum of 388,800 acre-feet in 1955. Water levels in many of the wells during 1987 fluctuated above the midpoint between record high and low levels, indicating an above average volume of ground water in storage in the aquifer during most of the year. In 1987, substantial increases in storage occurred during the late spring and early summer, after which water levels remained above average in most of the area. Analyses of water samples from 83 wells and 3 springs in the Edwards aquifer show that the water quality in the freshwater zone is significantly better than the level established for public water systems. However, trace concentrations of organic compounds were detected in many of the analyses. Analyses of water samples collected from 10 wells in Uvalde County showed concentrations of tetrachloroethylene in excess of 5 micrograms per liter. In 1987, samples were collected and analyzed from wells along the “bad –water” line and did not detect changes in water quality as the potentiometric head in the Edwards aquifer changed. Note: Large-format versions of the plates for this report are available at:https://www.edwardsaquifer.org/wp-content/uploads/2019/05/1988_NalleyRettman_1987HydrologicData.pdf |
Search for Documents
Advance Search
Explore EAA's Scientific Reports
- All Reports
- Groundwater Movement
- Geomorphology and Caves
- Weather Modification
- Geology
- Water Use and Conservation
- Geochemistry
- Water Resources Planning and Management
- Floods and Drought
- Water Quality
- Climatology
- Surface Water / Groundwater Relationship
- Biology
- Springs, Groundwater Discharge
- Archaeology
- RZ Protection
- Aquifer Levels
- Remote Sensing
- Precipitation
- Overview Studies
- Modeling
- Hydrology and Hydrogeology
- History
- Groundwater Recharge, Recharge Zone
