Conditions
Maps & GIS
Edwards Aquifer Maps and GIS Library
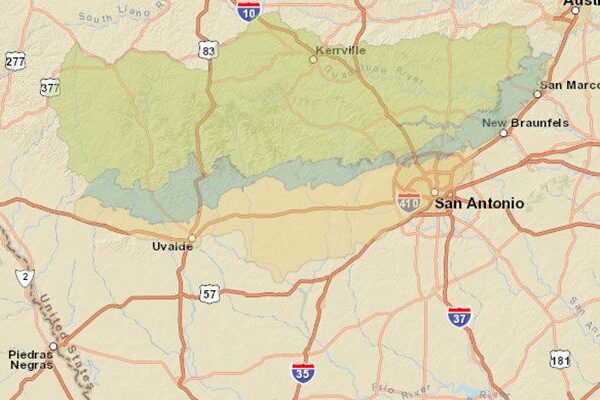
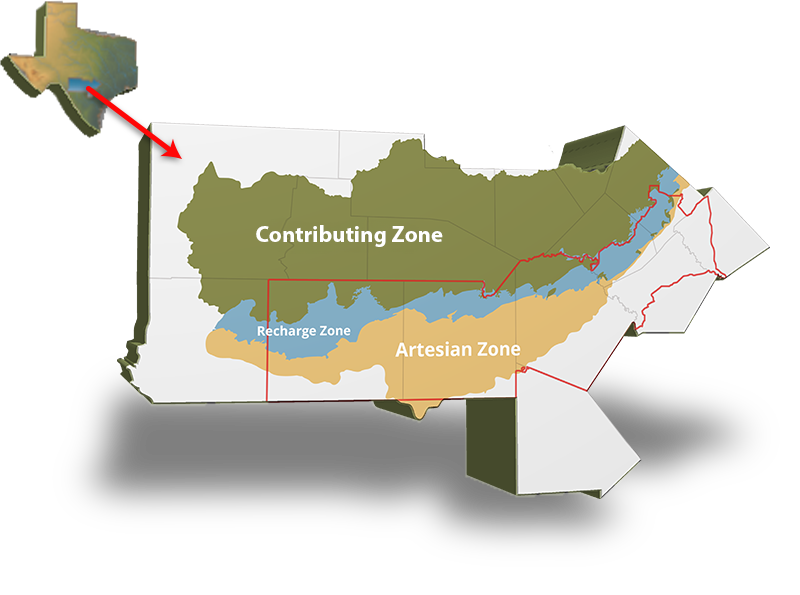
Located in the heart of south central Texas, the Edwards Aquifer is the natural water resource that supports approximately 2 million of us. It is part of a much larger system that spans approximately 8,800 square miles.
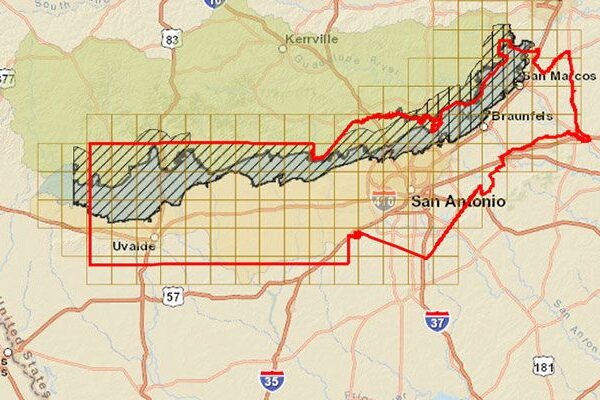
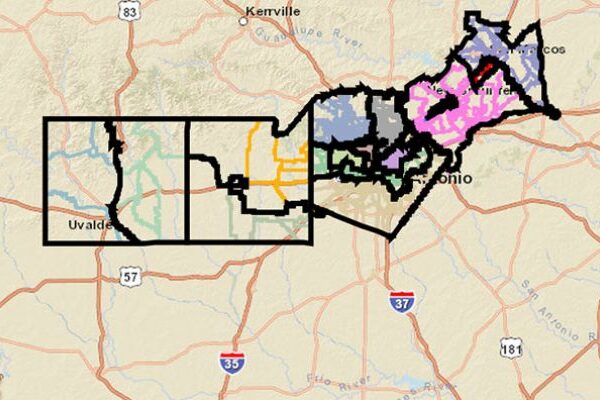
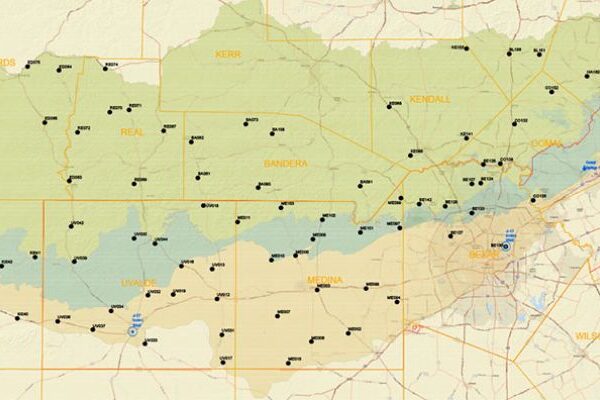
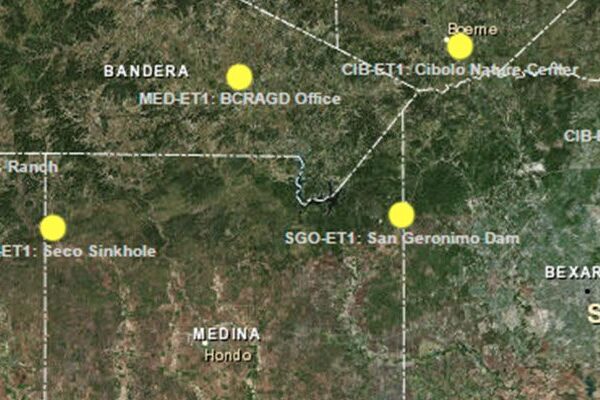
The Edwards Aquifer Authority manages the San Antonio segment of the Balcones Fault Zone. This area covers all or parts of eight counties including Uvalde, Medina, Atascosa, Bexar, Comal, Guadalupe, Hays, and Caldwell Counties.
Online Mapping Tool Instructions
The following tips will assist in using the online mapping tool available by clicking on the “View Web Map and Map My Location” buttons in each expandable section below.
- Enter places and addresses in the search bar at the upper right of the screen. (This is a global search so don’t stop typing at the street, include the city too.)
- Choose the correct address to zoom there.
- Click next to the marker to see a pop-up of information about all the intersecting features in that location.
- Click on any feature to see a pop-up of information about it. Click the blue arrow to see information about other features in that location.
- Change the background from topographic to streets or aerial by clicking on ‘Basemap’ in the upper left.
- Click ‘Legend’ in the upper left to view the symbols representing features on the map.
- Click ‘Layers’ in the upper left to access options such as turning on and off layers.
- Click ‘Details’ in the upper left to display instructions.
- Click ‘Share’ in the upper center-right to share map on social media or to get a link to share.
- Pan and zoom with the mouse buttons and using the + and – signs, then return to default view by clicking the house (home) symbol between the + and -.
- On GPS-enabled mobile devices, click the crosshair symbol under the – sign to zoom to current location.