The EAA Act: A Success Story
The EAA Act is the guiding legislation for the EAA, requiring comprehensive regulation to protect the water rights of permit holders and to preserve the aquifer for all that depend upon it. The passage of Senate Bill Number 1477 in 1993, was scheduled to become effective on September 1. However, due to legal battles, the EAA did not become fully operational until June 28, 1996.
Recently, the EAA analyzed Edwards Aquifer water-use trends to see what measurable impacts, if any, have occurred since the implementation of the act. We asked, “What would our aquifer look like without these mandates?”
The findings were startling. Clearly, we have learned to do more with less, but why? The pumping limitations of a permitting system, the value assigned to Edwards water by the creation of the Edwards water market and the introduction of improved technologies are all factors that help sustain our main water source while also giving rise to a great, regional conservation ethic.
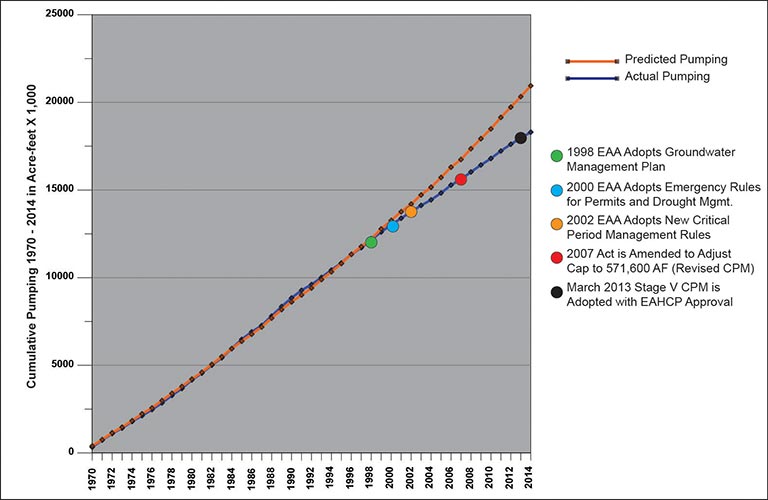
Case in point: A long and sustained growth trend in pumping from the aquifer that tracks back to the 1940s suddenly began to flatten in 1997 and has remained flat since. In other words, because of the EAA Act, pumping growth was stopped.
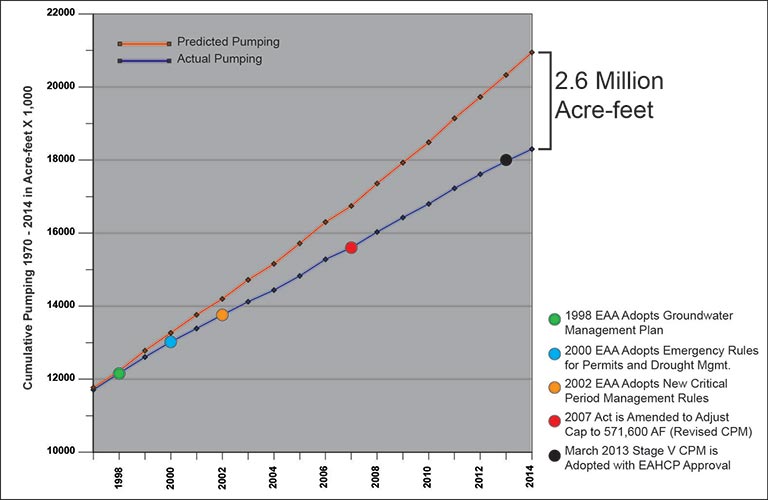
A comparison of historic pumping trends to those between the years 1997 and 2014 indicates that an estimated 2.6 million acre-feet of Edwards water, which in years past would have been pumped (based on pumping growth projections) to meet demand, stayed in the aquifer.
This quantity of water left in the aquifer translates to approximately 1.95 million acre-feet of resulting springflow, which benefits threatened and endangered species and river flows; 650,000 acre-feet (more than two billion gallons) more water in the aquifer; and, on average, aquifer water levels 17 feet higher than otherwise predicted for this 1997-2014 period.
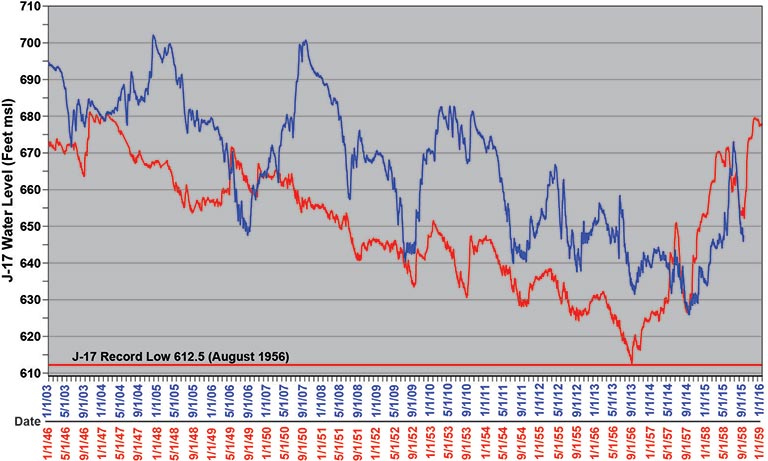
To emphasize the point, without this conserved water Comal Springs likely would have gone dry during the summer of 2014 because of the drought, as they did during the historic drought of the 1950s. This is important given that maintaining continuous minimum springflows to comply with federal law and keep the aquifer under local control is the purpose for which the EAA Act was passed and implemented.
We would have been much worse off during the most recent drought had we all not been doing our part in the years leading up to it. Regulatory limitations are certainly part of the formula, but so is the human aspect. Across our region, we have come to value and accept our role in preserving the aquifer to the point that we can endure a drought such as the last one, with greater assurance than ever before. Together, all of us who depend on the Edwards Aquifer have shown definitively that we are up to the challenge.
Quick Facts
Managing The Aquifer During Severe Drought Through The EAA Act
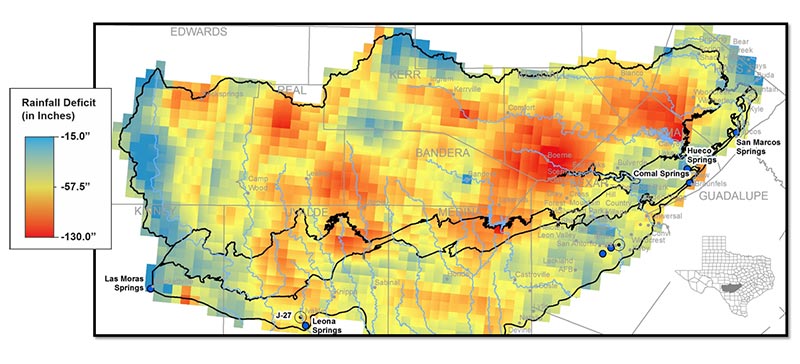
- Over the period 2003 – 2014, cumulative rainfall deficits averaged about 82 inches regionally (some areas were far worse)
- The period 2008 – 2014 represents the worst drought since the drought of record in the 1950’s
- 2011 was the driest year on record in Texas with a statewide average rainfall of 14.88-inches (normal rainfall statewide is 27.92-inches)
- Rainfall in 2015 was above average but not sufficient to make up for the deficit

Pumping Trends – Pre Vs. Post EAA Act:
- By the end of 2014, actual permitted pumping from the Edwards was 2.6 million acre-feet less than predicted by a population growth model for the period 1997 through 2014. Average annual increase in pumping between 1947 and 1997 was approximately 6,100 acre-feet.
- Since 1997 when the EAA began its initial review of permit requests, the annual growth rate in pumping has stopped, despite a population increase of 670,000 residents in the primary five-county EAA region (Uvalde, Medina, Bexar, Comal and Hays) during the same period.
- Summer peak pumping rates have stabilized since the EAA enacted initial regular permits in 2001 and implemented Critical Period Management strategies in 2002.

Pumping Trends – Actual Vs. Predicted
By the end of 2014, actual permitted pumping from the Edwards was 2.6 million acre-feet less than predicted by a population growth model for the period 1997 through 2014.

2.6 Million Acre-Feet Saved Translates To:
- 1.95 million acre-feet of springflow that has directly benefited threatened and endangered species of the Edwards Aquifer and regional river flows.
- 650,000 acre-feet of water in the Edwards Aquifer itself (approximately the combined annual amount of water discharged through wells and springs).
- Water level averages at the San Antonio Pool index well J-17 are approximately 17 feet higher than otherwise predicted. (Without EAA permit system and critical period management in place, current drought would have resulted in aquifer levels lower than those recorded during drought-of-record.)
- Flows from Comal Springs are approximately 90 cubic feet per second (cfs) higher on average than otherwise predicted for the period 1997-2014 (i.e. Without EAA permit system and critical period management in place, these springs would have gone dry during summer 2014).
- Flows from San Marcos Springs are approximately 45 cfs higher on average than otherwise predicted for the period 1997-2014.

