 Conditions
Science & Data Document Library
Science and Data Resources
Geologic Framework and Hydrogeologic Characteristics of the Edwards Aquifer, Uvalde County, Texas
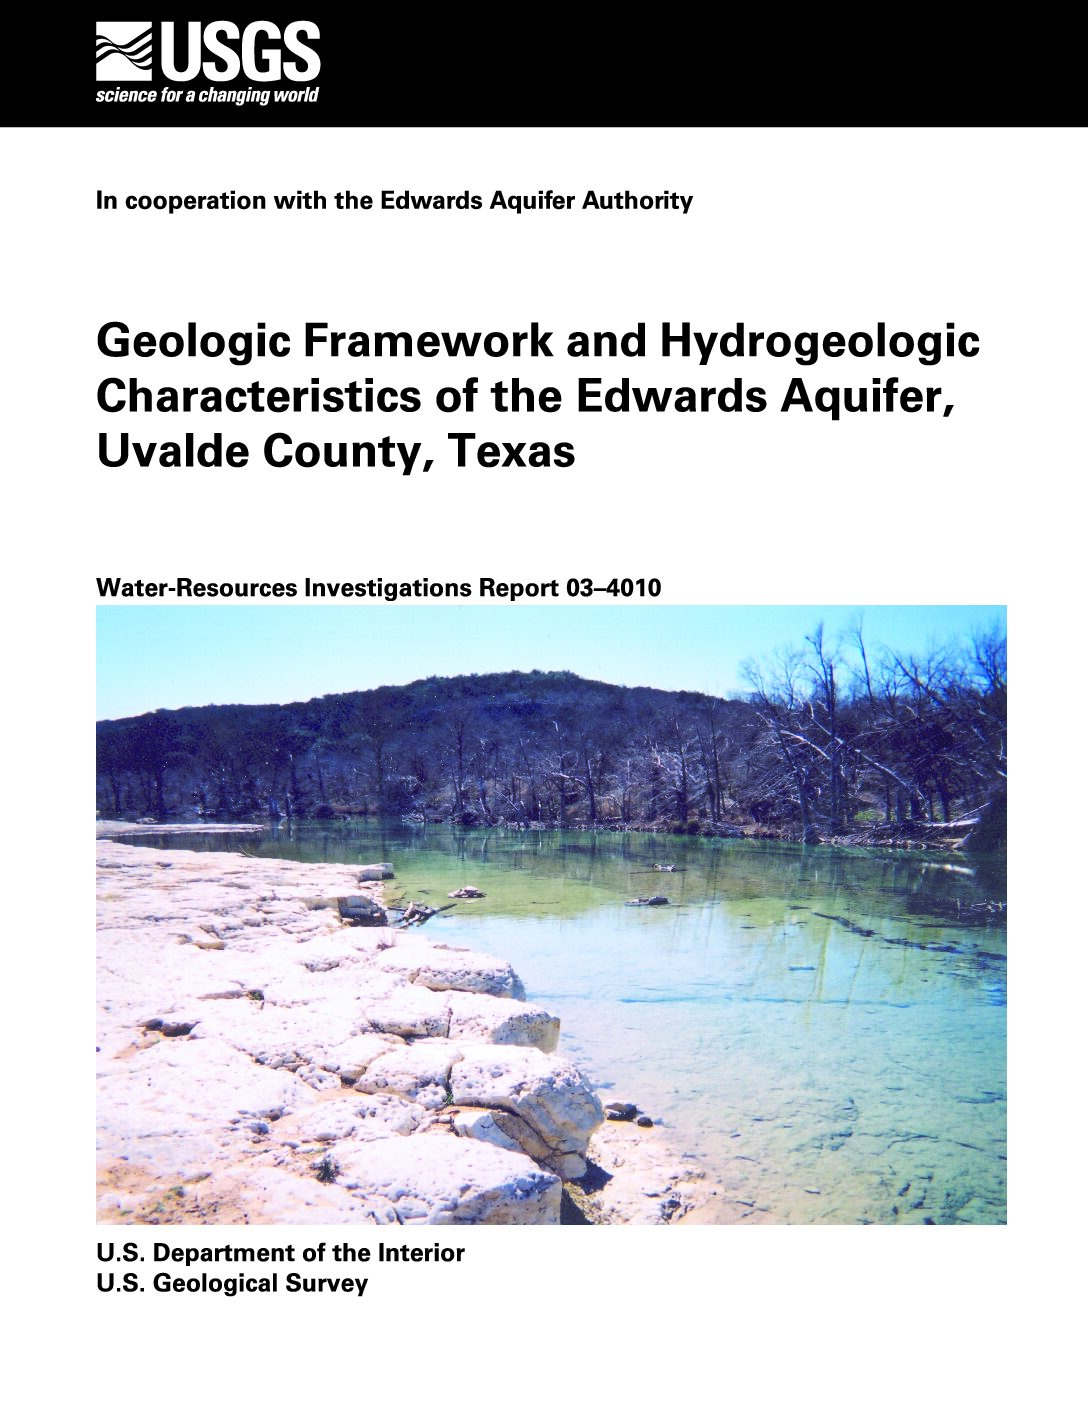
Description: Geology and hydrogeology of the Edwards Aquifer in Uvalde County, TX
Report Number: USGS WRIR 03-4010
Location: Uvalde County
Summary:The Edwards aquifer in Uvalde County is composed of Lower Cretaceous carbonate (mostly dolomitic limestone) strata of the Devils River Formation in the Devils River trend and of the West Nueces, McKnight, and Salmon Peak Formations in the Maverick basin. Rocks in the Devils River trend are divided at the bottom of the Devils River Formation into the (informal) basal nodular unit.
Maverick basin rocks are divided (informally) into the basal nodular unit of the West Nueces Formation; into lower, middle, and upper units of the McKnight Formation; and into lower and upper units of the Salmon Peak Formation. The Edwards aquifer overlies the (Lower Cretaceous) Glen Rose Limestone, which composes the lower confining unit of the Edwards aquifer. The Edwards aquifer is overlain by the (Upper Cretaceous) Del Rio Clay, the basal formation of the upper confining unit.
Upper Cretaceous and (or) Lower Tertiary igneous rocks intrude all stratigraphic units that compose the Edwards aquifer, particularly in the southern part of the study area. The Balcones fault zone and the Uvalde salient are the principal structural features in the study area. The fault zone comprises mostly en echelon, high-angle, and down-to-the-southeast normal faults that trend mostly from southwest to northeast. The Uvalde salient”resulting apparently from a combination of crustal uplift, diverse faulting, and igneous activity”elevates the Edwards aquifer to the surface across the central part of Uvalde County. Downfaulted blocks associated with six primary faults”Cooks, Black Mountain, Blue Mountain, Uvalde, Agape, and Connor”juxtapose the Salmon Peak Formation (Lower Cretaceous) in central parts of the study area against Upper Cretaceous strata in the southeastern part.
The carbonate rocks of the Devils River trend and the Maverick basin are products of assorted tectonic and depositional conditions that affected the depth and circulation of the Cretaceous seas. The Devils River Formation formed in a fringing carbonate bank”the Devils River trend”in mostly open shallow marine environments of relatively high wave and current energy. The West Nueces, McKnight, and Salmon Peak Formations resulted mostly from partly restricted to open marine, tidal-flat, and restricted deep-basinal environments in the Maverick basin.
The porosity of the Edwards aquifer results from depositional and diagenetic effects along specific lithostratigraphic horizons (fabric selective) and from structural and solutional features that can occur in any lithostratigraphic horizon (non-fabric selective). In addition to porosity depending upon the effects of fracturing and the dissolution of chemically unstable (soluble) minerals and fossils, the resultant permeability depends on the size, shape, and distribution of the porosity as well as the interconnection among the pores. Upper parts of the Devils River Formation and the upper unit of the Salmon Peak Formation compose some of the most porous and permeable rocks in Uvalde County.
Carbonate Geology and Hydrology of the Edwards Aquifer in the San Antonio Area, Texas
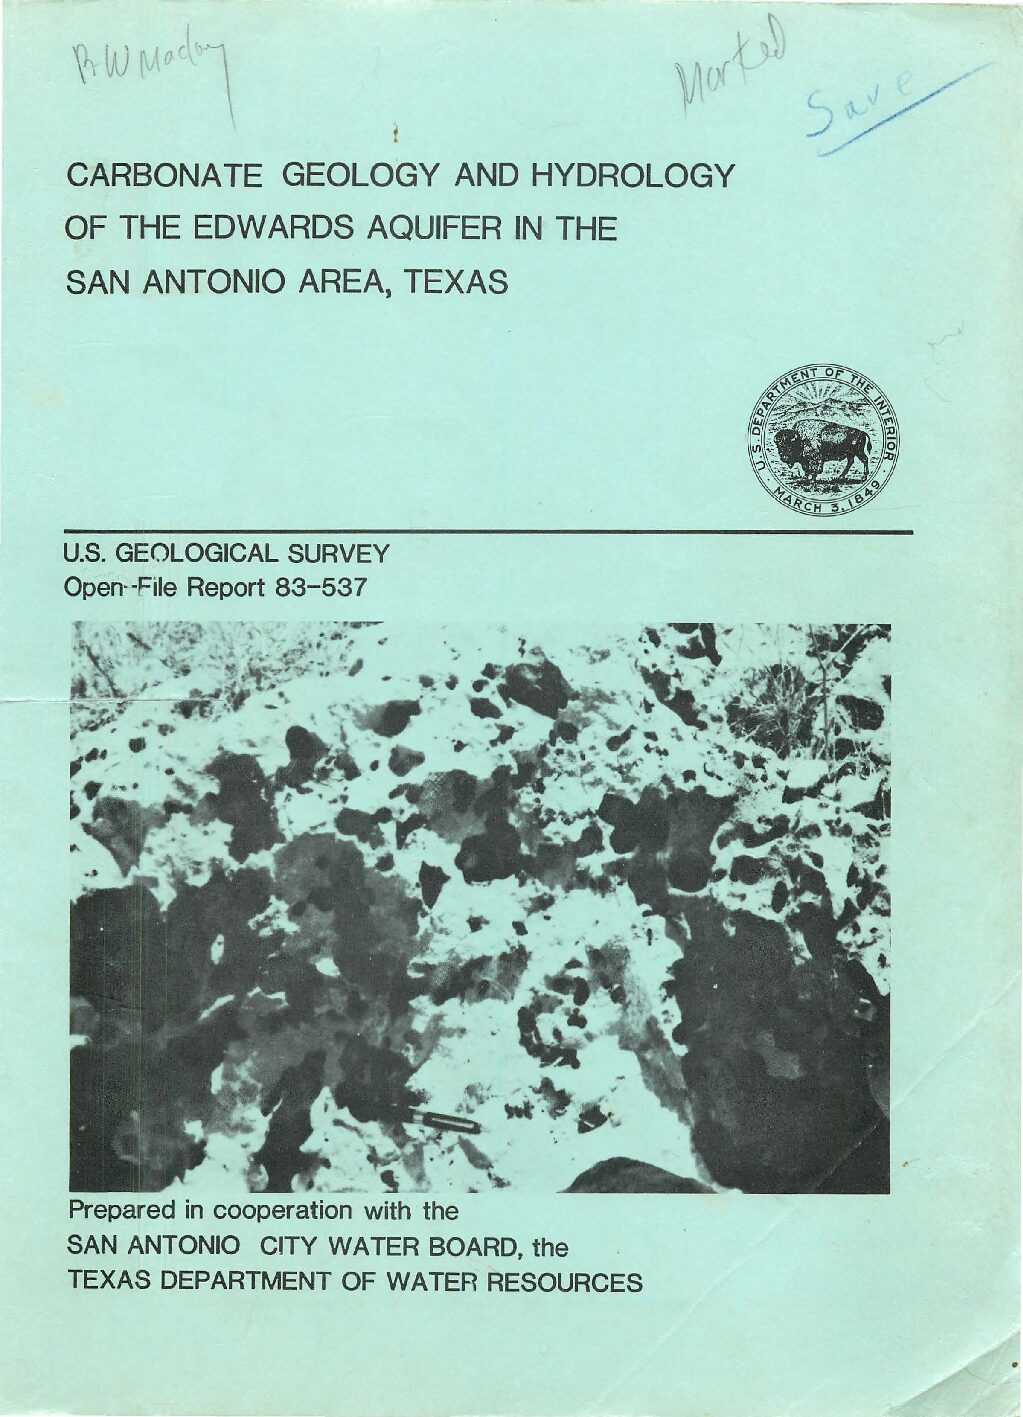
Description: Hydrostratigraphic subdivisions, types of rock, permeability and groundwater movement in the Edwards Aquifer in the San Antonio region
Report Number: USGS O-FR 83-537
Location: Edwards Aquifer, Balcones Fault Zone, San Antonio Segment
Summary:Regional differences in the porosity and permeability of the Edwards aquifer are related to three major depositional areas, the Maverick basin the Devils River trend, and the San Marcos platform, that existed during Early Cretaceous time. The rocks of the Maverick basin are predominantly deep basinal deposits of dense, homogeneous mudstones of low primary porosity. Permeability is principally associated with cavernous voids in the upper part of the Salmon Peak Formation in the Maverick basin. The rocks of the Devils River trend are a complex of marine and supratidal deposits in the lower part and reefal or inter-reefal deposits in the upper part. Permeable zones, which occur in the upper part of the trend, are associated with collapse breccias and rudist reefs. The rocks of the San Marcos platform predominantly are micrites that locally contain collapse breccias, honeycombed, burrowed mudstones, and rudist reef deposits that are well leached and very permeable. The rocks of the San Marcos platform form the most transmissive part of the Edwards aquifer in the San Antonio area. Karstification of the rocks on the San Marcos platform during Cretaceous time enhanced the permeability of the aquifer.
Permeability of the Edwards aquifer is greatest in particular strata (lithofacies) which have been leached in the freshwater zone. Ground water moves along vertical or steeply inclined fractures that are passageways by which water can enter permeable strata. Water moves from the fractures into beds formed by collapse breccias, burrowed wackestones, and rudist grainstones that have significant secondary porosity and permeability. Water has selectively dissolved sedimentary features within those rocks to increase the size of the openings and the degree of interconnection between pore voids.
Recognition of the hydrostratigraphic subdivisions provides a basis for defining the nonhomogeneity of the aquifer and determining its storage characteristics. The aquifer is considered to be a faulted and multilayered aquifer in which lateral circulation is mainly through very permeable, hydrostratigraphic subdivisions that are hydraulically connected at places by openings associated with steep-angle, normal faults. The Edwards aquifer is vertically displaced for its entire thickness at places along major northeastward trending faults. At these places, ground-water circulation is diverted either southwest or northeast.
Helicopter Electromagnetic and Magnetic Survey Data and Maps, Northern Bexar County, Texas
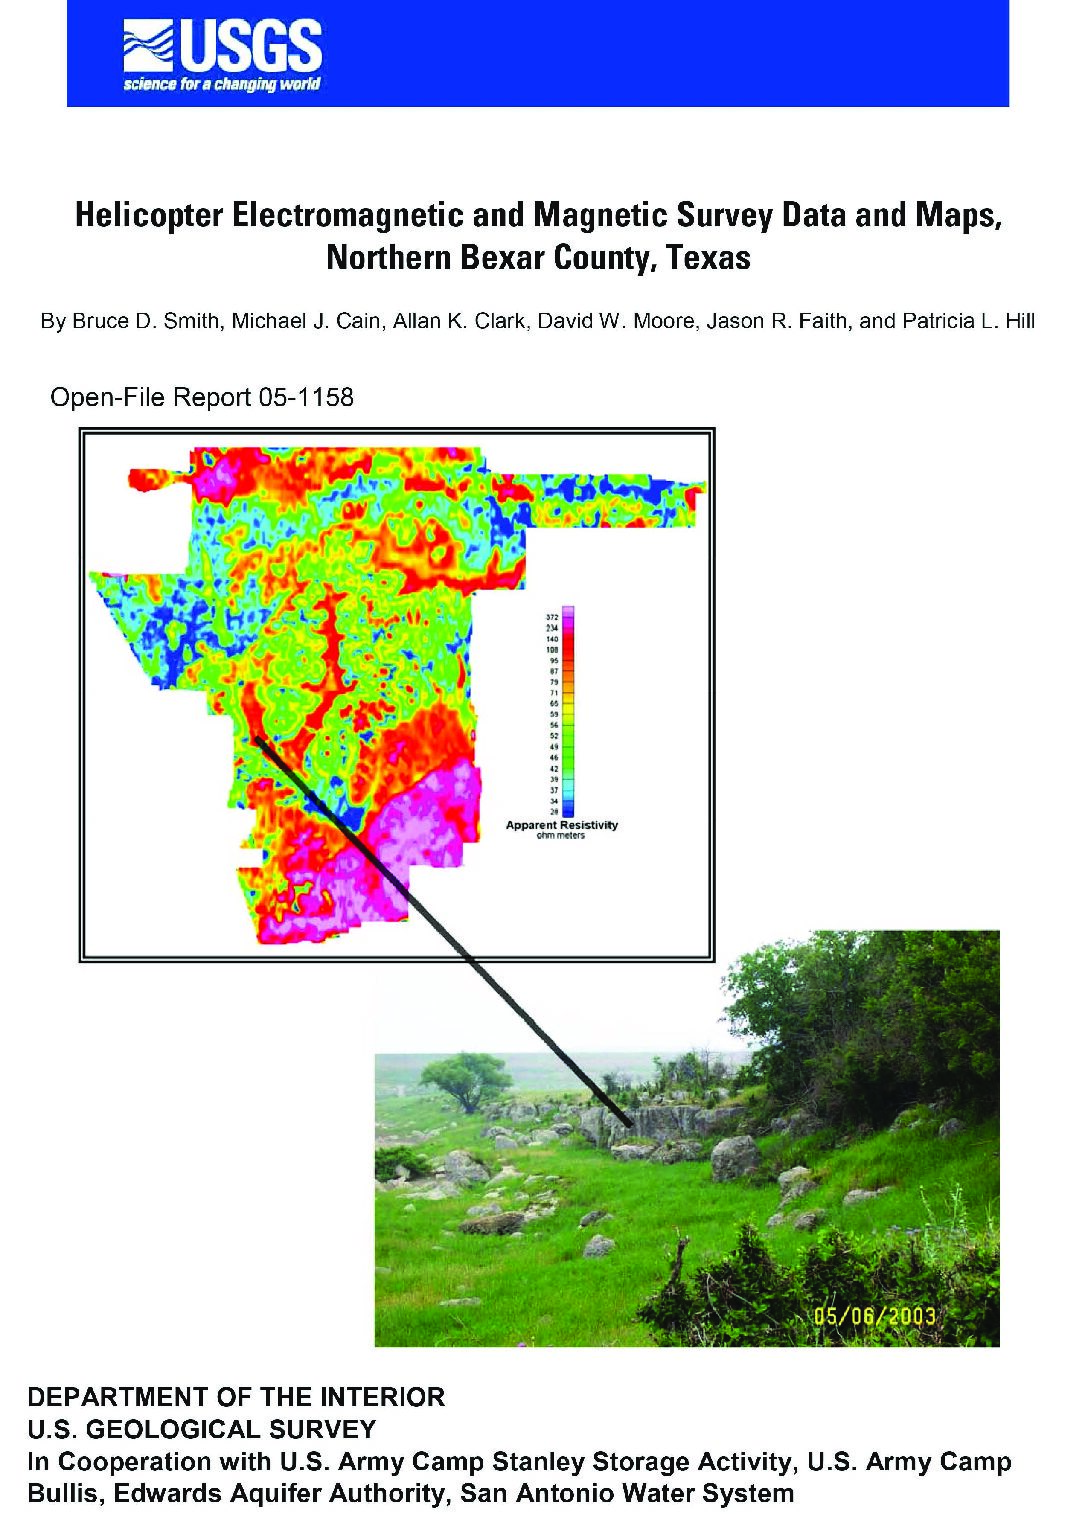
Description: Helicopter survey of electromagnetic and magnetic properties with hydrologic application around Northern Bexar County, TX
Report Number: USGS O-FR 2005-1158
Location: Bexar County
Summary:This open-file report is a data release for a helicopter electromagnetic (HEM) and magnetic geophysical survey flown in early December 2003, in Northern Bexar County, Texas (fig. 1). The U.S. Geological Survey (USGS) contracted the survey to Fugro Airborne of Toronto, Canada. Fugro flew a similar survey under contract to the USGS in the Seco Creek area (fig. 1) of the Edwards aquifer (Smith and others, 2003). The objective of these surveys was to collect geophysical data to map and image subsurface features important in understanding ground-water resources in the area (Smith and others, 2003). In particular, the survey has refined the location of mapped faults in the survey area and suggested many unmapped faults exist. These faults can control ground-water flow and storage. New lithologic variations in the Edwards Recharge were mapped in both the shallow and deep subsurface. Images of the subsurface in the confined zone demonstrated a structural complexity not previously appreciated. Geophysical mapping in the Trinity aquifer also showed previously unmapped structures and lithologic variations.
The success of the airborne geophysical work at Seco Creek (Smith, Irvine, and others, 2003) led to a meeting of USGS and Camp Stanley Storage Activity (CSSA, Brian Murphy) personnel organized by Parsons Technology (Gary Cobb) to evaluate the possible use of airborne geophysical methods at that site. The area of the CSSA, about 10 square miles, is considerably smaller than the Seco Creek survey area of 80 square miles. Consequently, the general cost per line mile for this small area was estimated to be a factor of 4 to 5 times higher than for the larger area of the Seco Creek survey. A proposal was submitted to the Camp Bullis environmental group to expand the survey area to include the military training site adjacent to CSSA. The USGS also submitted a funding proposal to the San Antonio Water System (SAWS) to fly the Cibolo Creek area north of the military sites and a proposal to the Edwards Aquifer Authority to fly the Edwards recharge area to the south. All of the proposals, in addition to the CSSA proposal, were at least partly funded. The resulting survey consisted of about 800 line miles (1,280 line kilometers) of HEM flying with a major portion of the area being Camp Bullis. A major constraint in flying the areas adjacent to the military sites and northern Bexar County is that urbanization of the city of San Antonio is rapidly expanding to the north, thus restricting low-level flying. An important reason for the project to map and to understand the subsurface Edwards aquifer is that it is the sole-source water supply for the city. As the city development expands northward in Bexar County, less area will be available for low-level aerial surveying including geophysics. A detailed map of survey boundaries is shown in figure 2.
Geophysical Survey Summary
The HEM survey used the RESOLVE© system flown by Fugro Airborne Surveys, which uses five horizontal coplanar coils and one vertical coaxial coil for electromagnetic field measurements. Appendix I, the contractor's report, gives details of the instrumentation and data processing procedures. The specific frequencies for the electromagnetic system are given in table 1. These frequencies are similar to those used in the Seco Creek survey except for the highest frequency that was nominally 100,000 Hz. The geophysical sensor housing (bird) includes the electromagnetic (EM) system, a total field magnetometer, differential kinematic Global Positioning System (GPS) and laser altimeter. The helicopter carries another differential GPS system, barometric and radar altimeters, and a video camera. Electromagnetic noise from power lines and natural sources (lightning) also are measured. The survey was flown with east-west flight lines and a nominal line spacing of 200 m with a sensor elevation of 30 m except as required for safety considerations and FAA regulations. In-fill lines were flown in the central part of the survey area to yield an effective flight line spacing of 100 m. Lines were also flown down Salado and Lewis Creeks (see cover photo) for additional resolution along drainages. North-south tie lines were flown to level the total field magnetic data.
Data-Release Summary
The digital data are described in detail in the following sections and in the contractor report (Appendix I). The data are organized into separate subdirectories in this data release. The subdirectories contain readme files describing the files in that directory. Table 2 is a summary of these directories with active links. The geographic data are referenced to NAD27, UTM14N unless otherwise specified. The line data in the LINEDATA directory are given in a Geosoft OASIS MONTAJ© database. A free data viewer is available from Geosoft (www.geosoft.com accessed 2/04/05) that can be used to convert the files to ASCII. Files given in the GRIDS subdirectory for the digital magnetic data, apparent resistivity data, and digital terrain model data (derived from the laser altimeter and GPS systems) can be read in the free viewer. Also included is a plug-in (SOFTWARE subdirectory) provided by Geosoft for ESRI programs such as ARCGIS (8.2 and higher) that reads Geosoft grids. The digital maps are all referenced to NAD27, UTM14N.
The airborne geophysical project for northern Bexar County includes an interpretational component. A report on results of this part of the study is in progress. Preliminary comparison of the new geophysical maps with the published geologic maps (A.K. Clark; 2003, 2004) show that the airborne survey provides new information about the location of structures and near surface lithologic variations.The apparent resistivity maps at the 6 survey frequencies provide a rough estimate of conductivity variations as a function of depth. The geophysical data suggest that 1) northwest trending structures that cross the northeast trend of the Balcones fault system are more extensive than currently mapped (A.K. Clark, 2003), 2) apparent resistivity trends in the Edwards recharge zone suggest possible lithologic or structural variations that have not been mapped, 3) the apparent resistivity data from the highest frequency (115,000 Hz) has trends that closely follow the mapped geology and suggest lithologic variations not previously mapped, and 4) differences in the lithologies of the Trinity and Edwards aquifers imply possible constraints in location of subsurface ground water flow paths. All of these preliminary interpretational observations suggest that further processing of the electromagnetic data will be useful in refinement of subsurface geologic and hydrologic features. Processing which is under way includes screening of areas affected by power line noise, and construction of resistivity depth sections (cross sections of resistivity variations) along each flight line.
Regional Distribution of Permeability in the Edwards Aquifer
Description: Quantitative distribution of various factors controlling permeability and analysis of geographic and geologic relationships in the Edwards aquifer. Note: Large-format versions of the plates for this report are available in a companion document.
Report Number: 95-02
Location: Edwards Aquifer
Summary:Note: Large-format versions of the plates for this report are available in a companion document.
The Edwards aquifer of South Texas is a dual-porosity/dual-permeability system. To describe the permeability structure of the aquifer quantitatively, the distribution of various factors controlling permeability was quantified, and geographic and geologic relationships were analyzed. The major contributors to permeability are (1) structurally controlled fractures and faults, (2) highly porous carbonate matrix, and (3) vertically and horizontally extensive cave systems.
Structural mapping of the Edwards Formation in outcrop and in the subsurface was used to define the location and amount of offset along faults and to define areas of potentially higher fracture intensity. Composite displacements of 1,400 to 1,850 ft (430 to 560 m) across the aquifer occur along a series of en echelon normal faults with throws of 100 to 850 ft (30 to 260 m). The areas between the en echelon faults, known as relay ramps, create and maintain the connection of the aquifer unit through faulted regions. Smaller faults and smaller relay ramps within the large fault-bounded blocks impact the permeability distribution primarily because of associated fractures.
Specific capacity test results from throughout the aquifer were used to calculate transmissivity using a relationship between specific capacity and transmissivity developed for the Edwards aquifer. Transmissivities vary eight orders of magnitude from 0.1 to 10,000,000 ft2/day (0.01 to 1,000,000 m2/day). Statistical analysis shows that transmissivity systematically varies In different areas of the aquifer but that variability within any area Is high, reflecting the heterogeneous contribution of fractures, matrix, and karst to transmissivity.
The distribution of caves and their relationship to stratigraphy and structure was examined using photomosaics of outcrops. Karst processes enlarge fractures by solution and increase their aperture and roughness. Preferential dissolution of dolomitic tidal flat and dolomitized subtidal facies creates stratigraphically controlled conduits and high, touching-vug permeability.
Intense diagenesis of the Edwards rocks is the principle control on the relationships between porosity and matrix permeability. Matrix porosity-permeability transforms were developed for (1) particle-dominated aquifer units, (2) the fine-grained Salmon Peak Formation, (3) particle-dominated units In outcrop, and (4) the saline portion of the Edwards, south and east of the aquifer.
Geologic Framework and Hydrogeologic Characteristics of the Edwards Aquifer Outcrop, Hays County, Texas
Description: Geologic and hydrogeologic description of the karstic limestone outcrops of the Edwards Aquifer Recharge Zone in Comal County, TX
Report Number: USGS WRIP 95-4265
Location: Hays County
Summary:All of the hydrogeologic subdivisions within the Edwards aquifer outcrop in Hays County have some porosity and permeability. The most porous and permeable appear to be hydrogeologic subdivision VI, the Kirschberg evaporite member of the Kainer Formation; hydrogeologic subdivision III, the leached and collapsed members, undivided; and hydrogeologic subdivision II, the cyclic and marine members, undivided, of the Person Formation.
The two types of porosity in the Edwards aquifer outcrop are fabric selective, which is related to depositional or diagenetic elements and typically exists in specific stratigraphic horizons; and not fabric selective, which can exist in any lithostratigraphic horizon. Permeability, the capacity of porous rock to transmit water, depends on the physical properties of the rock such as size, shape, and distribution of pores, and fissuring and dissolution.
Two faults, San Marcos Springs and Mustang Branch, completely, or almost completely, offset the Edwards aquifer by juxtaposing Edwards aquifer limestone against nearly impermeable upper confining units along parts of their traces across Hays County. These faults are thought to be barriers, or partial barriers, to groundwater flow where the beds are juxtaposed.
In Hays County, the Edwards aquifer probably is most vulnerable to surface contamination in the rapidly urbanizing areas on the Edwards aquifer outcrop. Contamination can result from spills or leakage of hazardous materials; or runoff on the intensely faulted and fractured, karstic limestone outcrops characteristic of the recharge zone.
Helicopter Electromagnetic and Magnetic Survey Data and Maps, Seco Creek Area, Medina and Uvalde Counties, Texas
Description: Helicopter survey of electromagnetic and magnetic properties with hydrologic application around the Valdina Farms sinkhole in Medina County, Texas
Report Number: USGS O-FR 2003-226
Location: Medina County, Uvalde County
Summary:The purpose of this study was to obtain an airborne electromagnetic survey of northern Medina County in the vicinity of the Seco Creek Sinkhole. The data indicated that the survey is effective to a depth of approximately 100 meters below grade and that the data shows more detailed geologic structure than previously prepared geologic maps. Geologic structure and their effects on groundwater flow can be interpreted from the data. The study was completed in July 2003 by the United States Geological Survey, Denver, Colorado.
A helicopter electromagnetic and magnetic (HEM) survey was completed of a 209 square kilometer (81 square miles) area of the central Edwards aquifer. This openfile report is a release of the airborne geophysical data and a summary of the hydrologic application. The survey area was centered on the Valdina Farms sinkhole along the Seco Creek drainage in western Medina County, Texas. Flight lines were flown north south with three east west tie lines to aid in leveling the magnetic data.
Additional lines were flown on each side of the Seco and Little Seco Creek drainages. A five kilometer (4 mile) extension of 15 lines was flown north of the main survey block centered on Seco Creek. This digital data release contains the flight line data, grids, and maps of the HEM survey data.
The Edwards aquifer in this area consists of three hydrologic zones: catchment, recharge, and confined. The Glen Rose Formation is exposed in the catchment area. The recharge zone is situated in the Balcones fault zone where the Devils River Group of the Edwards aquifer has been exposed by normal faults. The magnetic data is not discussed in depth here, but does have high amplitude closed anomalies caused by shallow igneous intrusives. The Woodard Cave Fault that separates the recharge and catchment zones is in places associated with a weak linear magnetic low.
The HEM data has been processed to produce apparent resistivities for each of the six EM coil pairs and frequencies. Maps of the apparent resistivity for the five horizontal coil pairs show that the catchment, recharge, and confined zones all have numerous linear features that are likely caused by structures, many of which have not been mapped. The distribution of high resistivity areas reflects the lithologic differences within the Trinity and Edwards aquifers.
Geologic Framework and Hydrogeologic Characteristics of the Edwards Aquifer Outcrop, Comal County, Texas
Description: Geologic and hydrogeologic description of the karstic limestone outcrops of the Edwards Aquifer Recharge Zone in Comal County, TX
Report Number: USGS WRIP 94-4117
Location: Comal County
Summary:All of the hydrogeologic subdivisions within the Edwards aquifer outcrop in Comal County have some porosity and permeability. The most porous and permeable appear to be Hydrogeologic subdivision VI, the Kirschberg evaporate member of the Kainer Formation; Hydrogeologic subdivision III, the leached and collapsed members, undivided; and hydrogeologic subdivision II, the cyclic and marine members, undivided, of the Person Formation. The two types of porosity in the Edwards aquifer outcrop are fabric selective, which is related to depositional or diagenetic elements and typically exists in specific stratigraphic horizons; and not fabric selective, which can exist in any lithostratigraphic horizon. Permeability, the capacity of porous rock to transmit water, depends on the physical properties of the rock such as pore size, shape, distribution, fissuring, and dissolution.
Two faults, Comal Springs and Hueco Springs, completely, or almost completely, offset the Edwards aquifer along much of their respective traces across Comal County. Porous and permeable Edwards aquifer limestone is juxtaposed against impermeable upper confining units in these areas. These faults completely, or almost completely, offset the Edwards aquifer and are thought to be barriers or partial barriers to groundwater flow where the beds are juxtaposed.
In Comal County, the Edwards aquifer is probably most vulnerable to surface contamination in the rapidly urbanizing areas on the Edwards aquifer outcrop. Possible contamination can result from spills, leakage of hazardous materials, or runoff onto the intensely faulted and fractured, karstic limestone outcrops characteristic of the recharge zone.
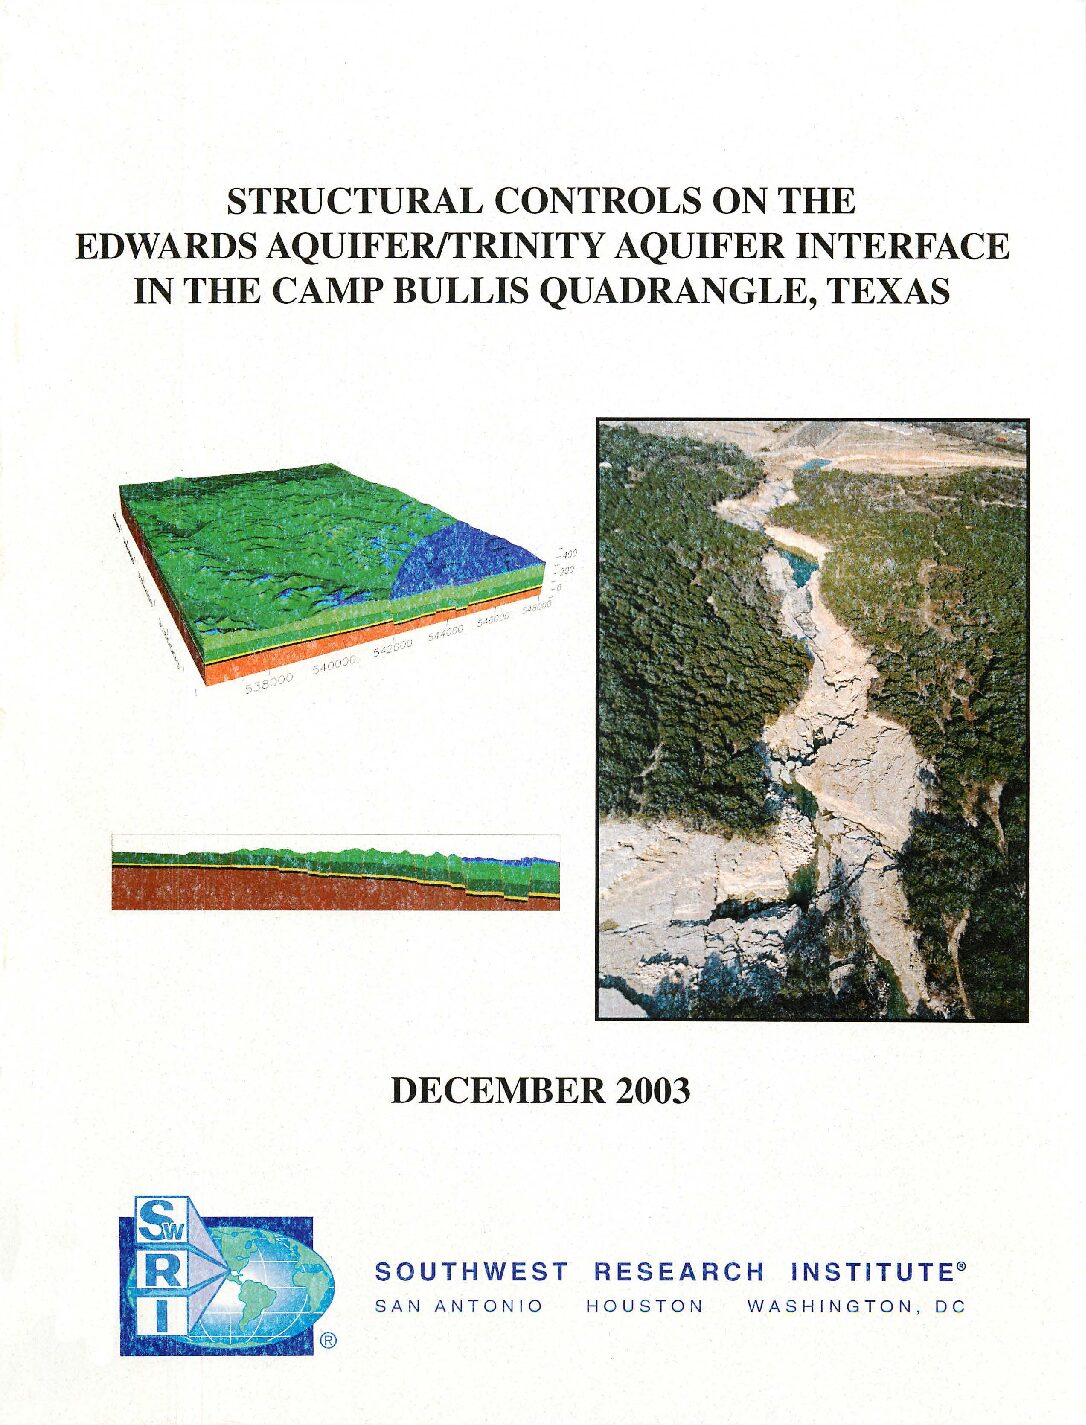
Structural Controls on the Edwards Aquifer/Trinity Aquifer Interface in the Camp Bullis Quadrangle, Texas
Description: Structural analyses for geologic framework model of the area around the intersection of the Edwards and Trinity Aquifers
Location: Edwards Aquifer, Balcones Fault Zone, San Antonio Segment, Trinity Aquifer, Bexar County
Summary:The purpose of this study was to generate a three-dimensional computer model and predictions of localized fault related deformation in the Edwards Aquifer and the Trinity Aquifer in the study area. The study also provided an analysis of the potential for hydraulic communication across the interface between the two aquifers, taking into account fault-related deformation and juxtaposition of the aquifers across key faults. The study was completed in December 2003 by Southwest Research Institute, San Antonio, Texas.
[From the Summary]
The purpose of the project reported here is to characterize the structural architecture of the Edwards and Trinity Aquifers for the area of the Camp Bullis 7 ½ minute quadrangle, and extending north to include Cibolo Creek in the southern part of the Bergheim 7 ½ minute quadrangle. Included in this analysis are tasks to generate a three-dimensional computer model of the Trinity and Edwards Aquifer, and perform field investigations to characterize the
mechanisms and products of localized fault-related deformation in the Edwards and Trinity Aquifers in and near the study area. An important objective is to analyze the potential for communication between the Edwards Aquifer and the Trinity Aquifers, taking into account fault-related deformation and juxtaposition of the aquifers across key faults.
Results of the project show the aquifer architecture throughout the study area, the location and interpreted geometry of the most important mapped faults in the study area, and the deformation
mechanisms and deformation style in fault zones in the rocks of both the Edwards and Trinity Aquifers. The three-dimensional geologic framework model of the Camp Bullis area reveals
(i) juxtaposition of permeable and relatively impermeable hydrogeologic units, (ii) structural thinning of the Edwards Aquifer and Trinity Aquifers, (iii) potential for cross-fault communication between the Trinity and Edwards Aquifers, (iv) faults expressed on the surface as potential infiltration pathways, and (v) maximum offset concentrated along a small number (two or three) fault systems. This information, along with an understanding of fault zone
deformation mechanisms and the role of fault zones as barriers or conduits, can assist in locating environmentally sensitive areas. It is useful for aquifer water flow path studies and contributes to
the identification of areas where communication between the Trinity and the Edwards Aquifers is suspected.
In this geologic framework model, the Edwards and Trinity Aquifers are subdivided into seven stratigraphic horizons which are offset by a network of 40 faults. Vertical offset (fault throw) ranges from near zero to an approximate maximum of 110 meters (361 ft). Displacement sense is normal, commonly down to the southeast, and lateral displacement gradients are small. In map view, fault blocks are elongate, with the long axis oriented NE-SW. Maximum offset is concentrated along three fault systems, the southernmost of which forms the northern boundary of the aquifer recharge zone, where rocks of the Edwards Group are in faulted juxtaposition with
rocks of the Glen Rose Formation.
Fault displacements within the Camp Bullis study area are too small to place the base of the Edwards Aquifer (Basal Nodular layer) against the permeable Lower Glen Rose layer. However, each fault decreases the effective aquifer thickness. This structural thinning of aquifer layers can cause flow constrictions, which in turn diverts flow and causes fluctuations in the local water table from fault block to fault block. Areas of such flow constrictions can be identified using a
map of fault throw distribution; constriction is greatest where fault throw is greatest.
In the Castle Hills quadrangle, immediately south of the Camp Bullis quadrangle, several faults offset the Edwards Aquifer by distances equal to or greater than its full thickness. Smaller fault displacements in the Camp Bullis area and the northern part of the Castle Hills quadrangle reduce the amount of direct juxtaposition of Kainer against Lower Glen Rose in these areas to a minimum. The lack of fault juxtaposition of the recognized highly permeable units of the Edwards Group and Glen Rose Formation in the Camp Bullis and Castle Hills areas suggests that simple juxtaposition is not likely to be a major source of aquifer communication in this area.
3DStress„¢ analysis of measured faults, and regional stratigraphic thicknesses based on published maps yield a stress system during faulting of: vertical effective stress = 15 MPa; minimum horizontal effective stress (F3²) = 4 MPa with an azimuth of 150°; and an intermediate principal effective stress = 9.5 MPa. When applied to the fault surfaces exported from the three-dimensional
geologic framework model, this stress tensor indicates that the dominant, NE-SW striking faults experience high slip tendencies and are well oriented to have accommodated regional strains developed within the inferred stress system. A few NW-SE trending faults
experience low slip tendencies and probably formed in response to local stress perturbations, indicating that local perturbations resulting from such effects as displacement-gradient-driven fault block deformation were not widely developed in this area. In addition to experiencing high slip tendencies in the inferred stress system, the predominant faults are also subject to high dilation tendencies. This combination of high slip and dilation tendencies implies that the major faults could have been effective fluid transmission pathways at the time of faulting. If a similar stress system were extant today, the faults would be in favorable orientations for fluid transmissivity.
Fault block deformation calculated using cutoff lines generated from the three-dimensional geologic framework model results in cutoff line elongations that rarely exceed 2% (positive or negative). These small cutoff elongations reflect the low displacement gradients on faults within the Camp Bullis study area. At the scale of the three-dimensional model, competent units exhibit gentle dips, which is consistent with relatively rapid lateral and vertical fault propagation, until intersection with other faults occurs (laterally) or intersection with a weaker mechanical layer occurs. This lack of steep lateral displacement gradients suggests rapid fault propagation with
respect to the rate of displacement accumulation on the faults.
Field work reveals interesting contrasts between faults in the Edwards and Trinity Aquifers. Faults with displacements of 5 m (16 ft) to tens of meters in the Glen Rose Formation (Trinity Aquifer) commonly have damage zones with widths on the order of meters, within which small faults and rotated fault blocks are common. Although faults with displacements of 5 m (16 ft) to tens of meters in the Edwards Group limestones typically have numerous associated small faults,
block rotation and bed tilting is not common. This characteristic difference in structural style between the Edwards Group limestones and the Glen Rose Formation appears to be related to lithologic differences and the resulting differences in mechanical behavior of the two stratigraphic sections. The Glen Rose Formation contains both competent massive limestone beds and incompetent argillaceous limestone and shale beds. Incompetent beds tend to arrest fault propagation during fault growth. Consequently, with increasing fault displacement, fault tips (terminations) episodically propagate then arrest. Continued displacement on a fault with an
arrested fault tipline will produce fault tipline folding and associated local deformation such as intense small scale faulting. Resulting fault damage zones can be quite complex and variable along a fault, related to the structural position (including displacement magnitude) and the associated mechanical stratigraphy. Permeability in fault zones and fault blocks is likely to be strongly influenced by the different deformation styles in mechanical layers, and the deformation progression with increasing fault displacement.
The large fault surfaces that cut multiple layers depicted in the Camp Bullis geologic framework model provide potential pathways for both vertical and lateral movement of water and hydraulic
communication between aquifers. These fault surfaces along with localized zones of relatively intense small scale faulting and extension fracturing, and limestone solution (karst conduit formation) provide likely communication pathways between the Trinity and Edwards Aquifers.
The structural analyses presented in this report provide the framework for more detailed investigations of groundwater levels, multiwell pumping (drawdown) tests, tracer studies, and geochemical investigations to further investigate potential groundwater communication between the Trinity and Edwards Aquifers in the Camp Bullis and Castle Hills Quadrangles.
Geologic framework and hydrostratigraphy of the Edwards and Trinity aquifers within northern Bexar and Comal Counties, Texas
Description: Geologic framework and hydrostratigraphy of the outcrops and hydrostratigraphy of the Edwards and Trinity aquifers within northern Bexar and Comal Counties, Tex.
Report Number: 3366
Location: Comal County, Bexar County
Summary:During 2014“16, the U.S. Geological Survey, in cooperation with the Edwards Aquifer Authority, documented the geologic framework and hydrostratigraphy of the Edwards and Trinity aquifers within northern Bexar and Comal Counties, Texas. The Edwards and Trinity aquifers are major sources of water for agriculture, industry, and urban and rural communities in south-central Texas. Both the Edwards and Trinity are classified as major aquifers by the State of Texas.
The purpose of this report is to present the geologic framework and hydrostratigraphy of the Edwards and Trinity aquifers within northern Bexar and Comal Counties, Tex. The report includes a detailed 1:24,000-scale hydrostratigraphic map, names, and descriptions of the geology and hydrostratigraphic units (HSUs) in the study area.
The scope of the report is focused on geologic framework and hydrostratigraphy of the outcrops and hydrostratigraphy of the Edwards and Trinity aquifers within northern Bexar and Comal Counties, Tex. In addition, parts of the adjacent upper confining unit to the Edwards aquifer are included.
Read more at the USGS website.
Structural mapping of the Edwards Aquifer in eastern and central Uvalde County, Texas, using seismic, well and outcrop data
Description: Structural mapping of the Edwards Aquifer in eastern and central Uvalde County, Texas, using seismic, well and outcrop data. Work performed under contract with the EAA by Thomas E. Ewing, Frontera Exploration Consultants; May 24, 2005
Location: Edwards Aquifer in eastern and central Uvalde County
Summary:In October, 2003, the Edwards Aquifer Authority engaged Frontera Exploration
Consultants, in particular Dr. Thomas E. Ewing its senior geoscientist, to interpret
licensed seismic data, integrate the data with available well control, and prepare a
structure map of the Edwards Aquifer in the Knippa Gap area of eastern and central
Uvalde County (Figure 1).
Better understanding of the Knippa Gap' constriction in the Edwards Aquifer,
and of flowpaths from western Uvalde County eastward towards Medina County, are a
high priority for Aquifer research. An important part of the constriction, lying south of
Old Sabinal Road near and east of the Frio River, has little well control. This area contains the apparent downdip limit of fresh water through the constriction, and is key to understanding flowpaths. Fortunately, a sparse network of 2D seismic reflection data was acquired by the oil and gas industry in and near this key area. Interpretation of this data, integrated with all available well and outcrop control, can yield a much more complete and more reliable intepretation of fault patterns and depths to the Edwards Group in the area.
The seismic reflection lines were acquired for deep exploration targets within the
Paleozoic Ouachita thrust belt. However, modern acquisition techniques provide enough
fold and coverage at shallow depths that the structural configuration of the aquifer can be
mapped.
Geologic framework and hydrostratigraphy of the Edwards and Trinity aquifers within Hays County, Texas
Description: Geologic framework and hydrostratigraphy of the Edwards and Trinity aquifers within Hays County, Texas
Report Number: 3418
Location: Hays County
Summary:The Edwards and Trinity aquifers are classified as major aquifers by the Texas Water Development Board and are major sources of water in south-central Texas, where Hays County is located. Detailed maps and descriptions of the geologic framework and hydrostratigraphic units (HSUs) of these karstic aquifers in Hays County are needed for water managers to effectively manage groundwater resources in the area. During 2016“18, the U.S. Geological Survey, in cooperation with the Edwards Aquifer Authority, documented the geologic framework and hydrostratigraphy of the Edwards and Trinity aquifers for a large part of Hays County, characterizing approximately 560 square miles of the county. The report includes a 1:24,000-scale hydrostratigraphic map and descriptions of the geology and HSUs in the study area. In addition, parts of the adjacent upper confining unit to the Edwards aquifer are described.
Read more at the USGS website.
Geologic Framework and Hydrostratigraphy of the Edwards and Trinity Aquifers Within Northern Medina County, Texas
Description: Geologic framework and hydrostratigraphy of the Edwards and Trinity aquifers within northern Medina County, Texas
Report Number: 3461
Location: Medina County
Summary:The karstic Edwards and Trinity aquifers are classified as major sources of water in south-central Texas by the Texas Water Development Board. During 2018“20 the U.S. Geological Survey, in cooperation with the Edwards Aquifer Authority, mapped and described the geologic framework and hydrostratigraphy of the rocks composing the Edwards and Trinity aquifers in northern Medina County from field observations of the surficial expressions of the rocks. The thicknesses of the mapped lithostratigraphic members and hydrostratigraphic units were also estimated from field observations.
Descriptions of the geologic framework and hydrostratigraphy of the Edwards and Trinity aquifers within northern Medina County are provided, as well as a detailed map of the hydrostratigraphy. In addition to the rocks that compose the Edwards and Trinity aquifers, parts of the adjacent upper confining unit to the Edwards aquifer are described. Compared to the level of detail available in existing geologic maps, the geologic map in this report was prepared at a scale of 1:24,000 to aid water managers as they work to anticipate and mitigate issues related to changing land use and increasing groundwater demands.
Read more at the USGS website.
Maps Showing Outcrops of the Edwards and Associated Limestones in the Principal Recharge Area of the Edwards Aquifer in Bexar County, Texas [6 maps]
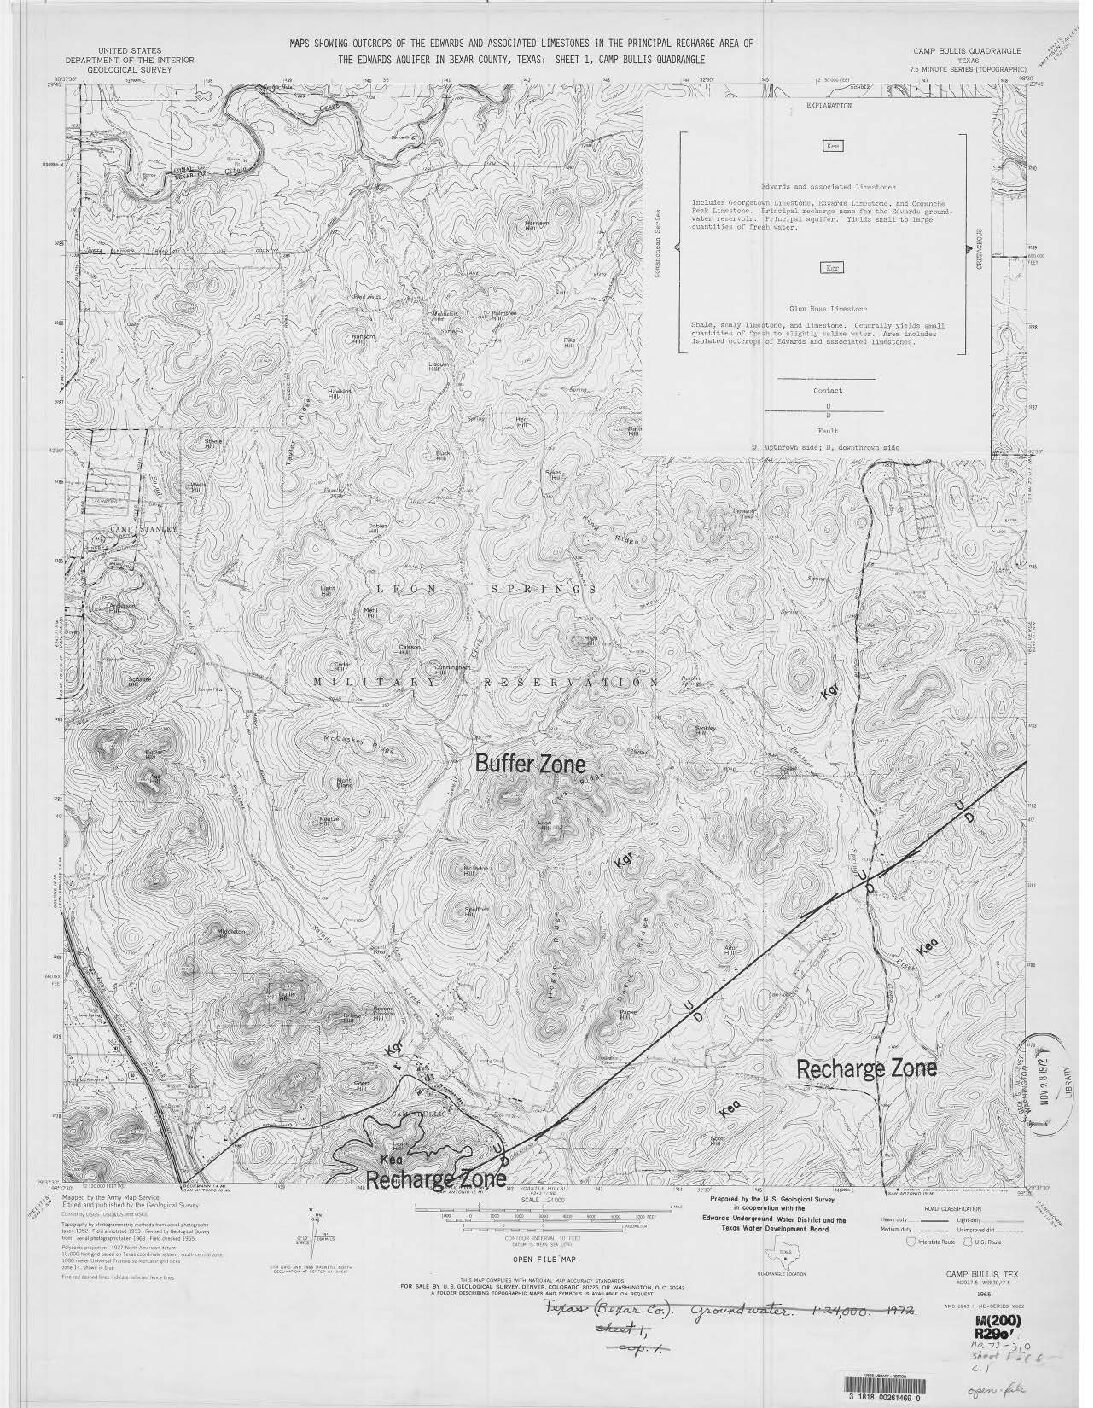
Description: Six topographic maps of the Edwards Aquifer Recharge Zone, scale 1:24,000. Camp Bullis Quadrangle, Bulverde Quadrangle, Helotes Quadrangle, Longhorn Quadrangle, Castle Hills Quadrangle, San Geronimo Quadrangle. Note: Both letter-size and full-size maps are included.
Report Number: USGS Open File Maps AMS 6243 11 NE-SERIES V882 1965, AMS 6343 Ill NW - SERIES V882 1967, AMS 6243 II SW-SERIES V882 1966, N 2930
Location: Edwards Aquifer Balcones Fault Zone San Antonio Segment, Recharge Zone, Bexar County
Summary:Six topographic maps of the Edwards Aquifer San Antonio region, scale 1:24,000.
Camp Bullis Quadrangle, Bulverde Quadrangle, Helotes Quadrangle, Longhorn Quadrangle, Castle Hills Quadrangle, San Geronimo Quadrangle. Note: Both letter-size and full-size maps are included.
Leak Detection Survey Report for the City of Uvalde, Texas, January 11, 1993-April 26, 1993
Description: Leak detection and location survey report for City of Uvalde, 1993. Note: this function was taken over by the San Antonio Water System in 2006.
Report Number: 93-02
Location: City of Uvalde
Summary:On October 5, 1992, the Edwards Underground Water District (EUWD) received a completed application form from the City of Uvalde requesting a leak detection/location survey on its water distribution system. A pre-survey conference was held October 22, 1992 at the City of Uvalde City Hall to discuss the work to be performed. It was agreed that EUWD would perform sonic leak detection on all available access points, computerized leak location as needed, record any unusual system conditions found, and submit to the City a revised master water plat with the final report.
Mark L. McGinnis of EUWD began the survey on January 11, 1993, and the survey was concluded on April 26, 1993. Over the course of the survey, EUWD surveyed a total of 6,345 access points including 5,091 customer service connections, 361 fire hydrants, 884 main line valves, and 9 other access points covering 89.89 miles of distribution mains.
Computer leak sound correlation was performed on 2 locations. EUWD technicians detected a total of 362 leaks. This total included 30 meter box leaks, 9 fire hydrant leaks, 9 service line leaks, 3 main leaks, 2 valve leaks, and 309 customer side leaks. EUWD estimates 17,525 gallons of water per day has been saved by the repair of 45 detected leaks as of April 26, 1993. The leaks discovered during the survey range from 2,160 gallons per day to numerous small meter box leaks.
As part of the survey, EUWD located 173 main line valves, 33 fire hydrants, and 20.2 miles of distribution main not shown on the master water plats. EUWD staff was unable to locate 97 main line valves and 17 customer service connections. An additional 112 valve stacks need cleaning and/or repair. EUWD noted 100 water meters that were not registering accurately.
Leak Detection Survey Report for Bexar Metropolitan Water District: San Antonio, Texas, February 10, 1992-January 8, 1993
Description: Leak detection and location survey report for Bexar Metropolitan Water District, San Antonio, 1993. Note: this function was taken over by the San Antonio Water System in 2006.
Report Number: 93-01
Location: San Antonio
Summary:On September 3, 1991, the Edwards Underground Water District (EUWD) received a completed application form from the Bexar Metropolitan Water District (BMWD) requesting a leak detection/location survey on its water distribution system. A pre-survey conference was held January 9, 1991 at the BMWD main office to discuss the work to be performed. It was agreed that EUWD would perform sonic leak detection on all available access points, computerized leak location as needed, record any unusual system conditions found, and submit to the utility an updated master water plat with the final report.
Mark L. McGinnis and John E. Gapinski of EUWD began the survey on February 10, 1992, and the survey was concluded on January 8, 1993. Over the course of the survey, EUWD surveyed a total of 37,716 access points including 30,270 customer service connections, 2,066 fire hydrants, 5,257 valves, and 123 other access points covering 421.37 miles of distribution mains. Computer leak sound correlation was performed on 17 locations by EUWD and numerous other locations by BMWD personnel.
EUWD technicians detected a total of 1,907 leaks. This total included 354 meter box leaks, 143 fire hydrant leaks, 44 service leaks, 21 main line leaks, 19 main valve leaks, and 1,326 customer side leaks. EUWD estimates 547,596 gallons of water per day has been saved by the repair of 375 detected leaks as of January 8, 1993. Additionally, 165 leaks were repaired without leakage estimates. The leaks discovered during the survey range from 129,600 gallons per day to numerous small meter box leaks.
As part of the survey, EUWD located 417 service connections, 60 service valves, 19 main valves, 17 fire hydrants, and 5 blow offs with valves not shown on the master water plats. EUWD staff were unable to locate 1,251 service connections and 799 valves shown on the master water plats. An additional 1,404 valve stacks need cleaning and/or repair and 90 valve and meter box lids were discovered missing.


