 Conditions
Science & Data Document Library
Science and Data Resources
Edwards Underground Water District, San Marcos Testing, Hays County, Texas
Description: Archaeological test site at Spring Lake, San Marcos, TX excavated prior to more extensive water monitoring activity.
Location: Spring Lake, San Marcos, Hays County, TX
Summary:A 1 m x 1 m test unit was excavated on the southern edge of Spring Lake in San Marcos, Texas at the location of a well site to be drilled by the Edwards Underground Water District. Very limited cultural resources were located in this investigation and thus no additional cultural studies are recommended.
Helotes Mulch Fire 2006 Tracing Groundwater Flow Using Natural Fluorescent Materials
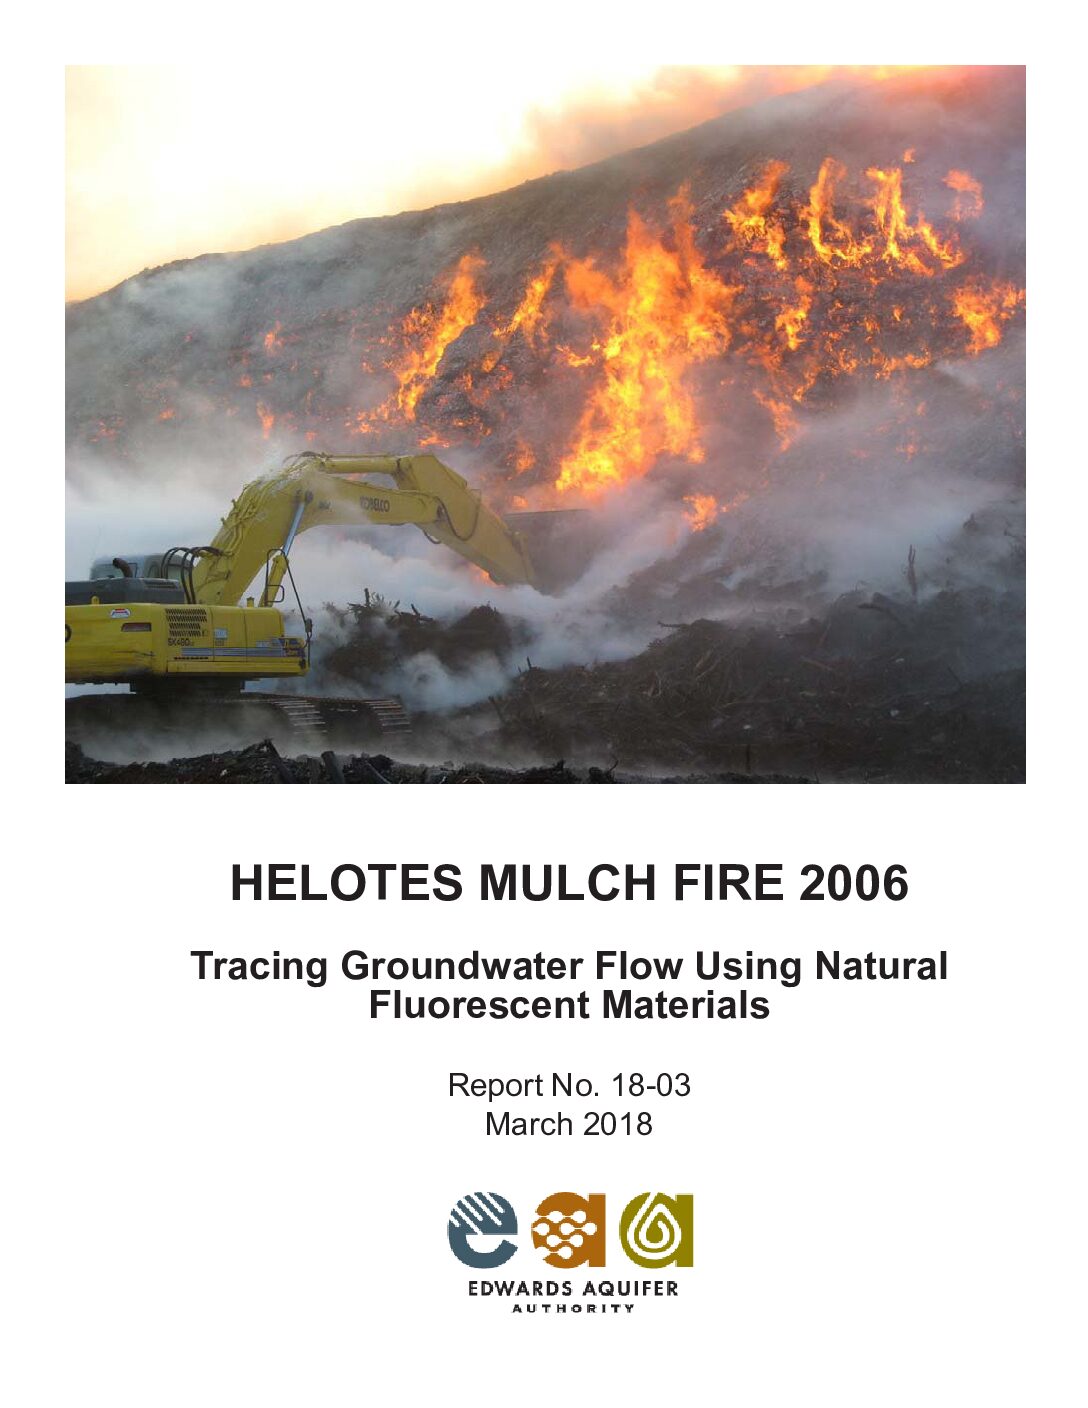
Description: With approximately 21 million gallons of water (LFCI, 2011) having been trained on the debris pile, the Helotes mulch fire effectively became a tracer test of huge proportions. It provided an opportunity for us to study the karst-related flow characteristics of the Edwards and Trinity aquifers. The fire-fighting water mobilized naturally fluorescing woody material and products of combustion that could be measured in groundwater using conventional fluorescence spectroscopy. Results revealed many of the characteristics of karst in both aquifers.
Report Number: 18-03
Location: Helotes, Edwards Aquifer, Trinity Aquifer, Helotes Creek
Summary:On the evening of December 25, 2006, an 80-foot high debris pile located in Helotes, Texas, caught fire as shown in Figure 1. The debris consisted of brush, trees, and other materials from area developers that had been converted to mulch over several years and stored until it reached approximately 400 feet (ft) long and 225 ft wide. After applying millions of gallons of water onto the pile, the fire was finally extinguished on March 28, 2007.
Re-Conceptualizing the Edwards Aquifer Authority Recharge Program: Staff Recommendations to Optimize and Protect the Edwards Aquifer
Description: Recharge is defined in the EAA Act as: Increasing the supply of water to the aquifer by naturally occurring channels or artificial means. Based on this definition, the EAA recharge program previously consisted of four recharge dams initially sponsored by the EUWD and Medina County Commissioners Court until calendar year 2004, when participation in the regional Precipitation Enhancement Program (PEP) was added to the program.
Location: Edwards Aquifer - San Antonio Area
Summary:Since the 1970s, the Edwards Aquifer Authority (EAA) and its predecessor agency, the Edwards Underground Water District (EUWD), have operated and maintained four recharge dams located on the recharge zone of the Edwards Aquifer (Aquifer) in Medina County. These structures were constructed by the EUWD on private properties through negotiated easement agreements with landowners within the Nueces River and San Antonio River basins for the purpose of artificially enhancing natural occurring recharge to the Aquifer. The Edwards Aquifer Authority Act (Act) further recognized the aquifer’s recharge capability by granting the EAA the authority to enter into cooperative contracts with political subdivisions of the State of Texas for artificial recharge and to own, finance, and construct recharge dams. To date, however, there have not been any new dams constructed.
Over time, with the advent of new technologies and improved understanding of the hydraulic nature of the Aquifer, the EAA Recharge Program has evolved beyond the concept of enhanced recharge (or dams) and has developed into a more comprehensive initiative focused on enhancing the available yield of and protecting the water quality in the Aquifer. As a result, today, enhanced recharge is only one of a multitude of tools available to the EAA in its mission to optimize the yield and protect the long-term sustainability of the Aquifer for its beneficial use.
Accordingly, this report is presented to communicate the updated scope and priorities of the EAA Recharge Program as they have evolved over time. Included is background information on the aquifer and its geologic and hydraulic attributes, summaries of various regional supply strategies and, finally, staff recommendations for the program’s future direction. Background information used to develop this document is derived from previous EAA staff presentations to the Board of Directors (two presented as Technical Briefings and three as reports to the Aquifer Management Planning Committee), which are summarized in the Appendix and available as electronic or hardy copy on request.
Recharge is defined in the EAA Act as: Increasing the supply of water to the aquifer by naturally occurring channels or artificial means. Based on this definition, the EAA recharge program previously consisted of four recharge dams initially sponsored by the EUWD and Medina County Commissioners Court until the calendar year 2004, when participation in the regional Precipitation Enhancement Program (PEP) was added to the program.
As shown in Figure 2, the EAA Recharge Program has evolved to include a comprehensive set of aquifer optimization and protection strategies. Protection strategies include enforcing EAA Act regulations, monitoring Edwards Aquifer Protection Programs (easements and stormwater basins) sponsoring the EA SRC, canvassing and assessing wells, and conducting water quality research. Management strategies resulting from the EAA Act, such as the EAHCP and Edwards transfers make the use of existing water resources more efficient. Storage strategies, such as the SAWS ASR, are an effective tool to supplement pumping demands during critical periods. These non-recharge optimization strategies combined with protective measures that address equally important water quality components add to the long-term sustainability of the aquifer system. In Figures 7a-b, the benefits of current aquifer optimization and protection strategies are summarized and quantified, where possible.
In addition to listed existing activities, EAA staff collaborates with regional entities and reviews the technical and legal merit of proposed projects to increase the firm yield of the aquifer. In the future, part of that collaboration could include hosting a workshop to bring regional planners, managers, purveyors, and scientists together to share thoughts regarding new optimization strategies. Although, hosting this type of event would require staff resources and funding to accomplish, it may provide a valuable forum for sharing optimization strategies between interested parties.
Note: EAA resources required to review project proposals can be a significant investment due to the complexity of issues and length of time involved. Based on past performance, staff believe that resources are adequate to continue this process without impacting our management fee. This could change, however, if the number or complexity of proposed projects increase.
Field and Laboratory Tests of Passive Sampling Techniques
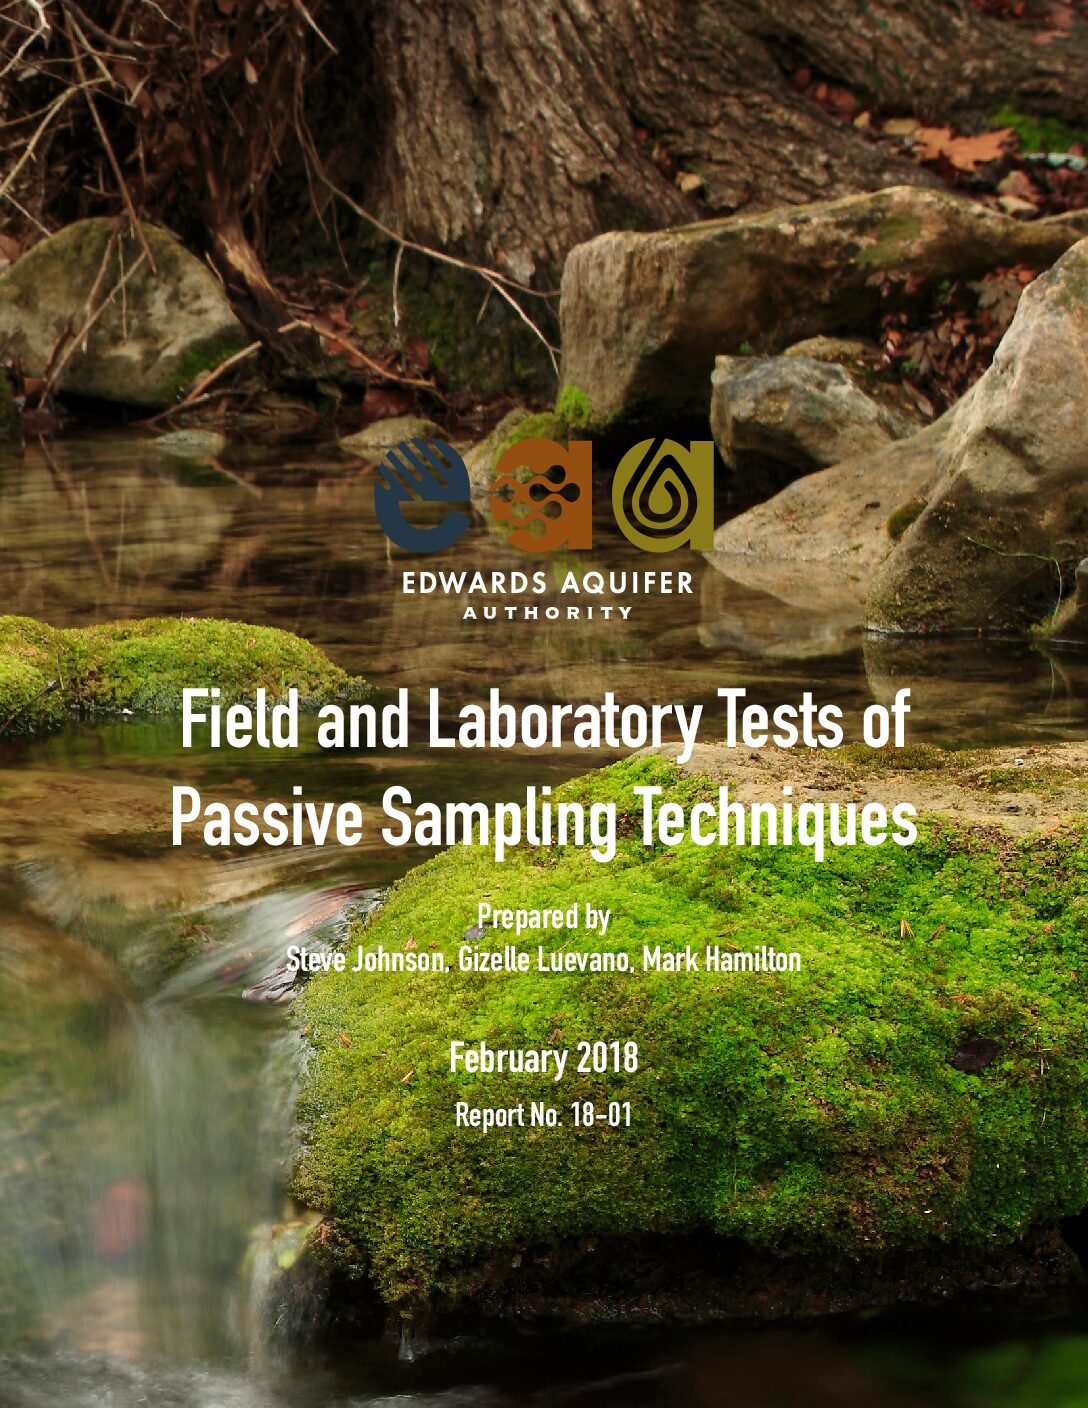
Description: One of the objectives of the study was to compare the results between the five urban wells and the two rural wells. Only one rural sample contained PCE, and all the other detections were fuel-related compounds, in contrast to the frequent detections of PCE in the urban wells.
Location: Edwards Aquifer, Bexar County, Hays County, Medina County, Uvalde County
Summary:Between 2007 and 2015, the Edwards Aquifer Authority (EAA) evaluated passive sampling devices for improving the collection of representative samples for its water quality monitoring program. Passive sampling techniques involve the placement of a passive sampling devices (PSD) in water over a prescribed time. While submerged, inorganic constituents and organic compounds diffuse through a porous membrane or sorb onto compatible media. PSDs are then recovered and analyzed for target analytes. Passive samplers offer the ability to monitor for selected analytes over a longer, continuous period compared to grab samples of water. Since PSDs concentrate sorbed compounds, they may indicate the presence of analytes that are not detectable by grab samples. Consequently, PSDs complement grab samples by offering detections at concentrations that are lower than the detection limits of compounds in the grab samples. The EAA aims to systematically evaluate passive sampling technologies to determine if PSDs may improve EAA's water quality sampling program, especially with respect to detecting transient chemicals or the presence of chemicals below laboratory detection limits for compounds dissolved in water.
Appendix C of Edwards Aquifer Authority Hydrologic Data Report for 2014
Description: Appendix C of Edwards Aquifer Authority Hydrologic Data Report for 2014 Year 2014 Water Quality Data
Report Number: Appendix C
Location: Edwards Aquifer - San Antonio Area
Summary:Appendix C of Edwards Aquifer Authority Hydrologic Data Report for 2014
Year 2014 Water Quality Data
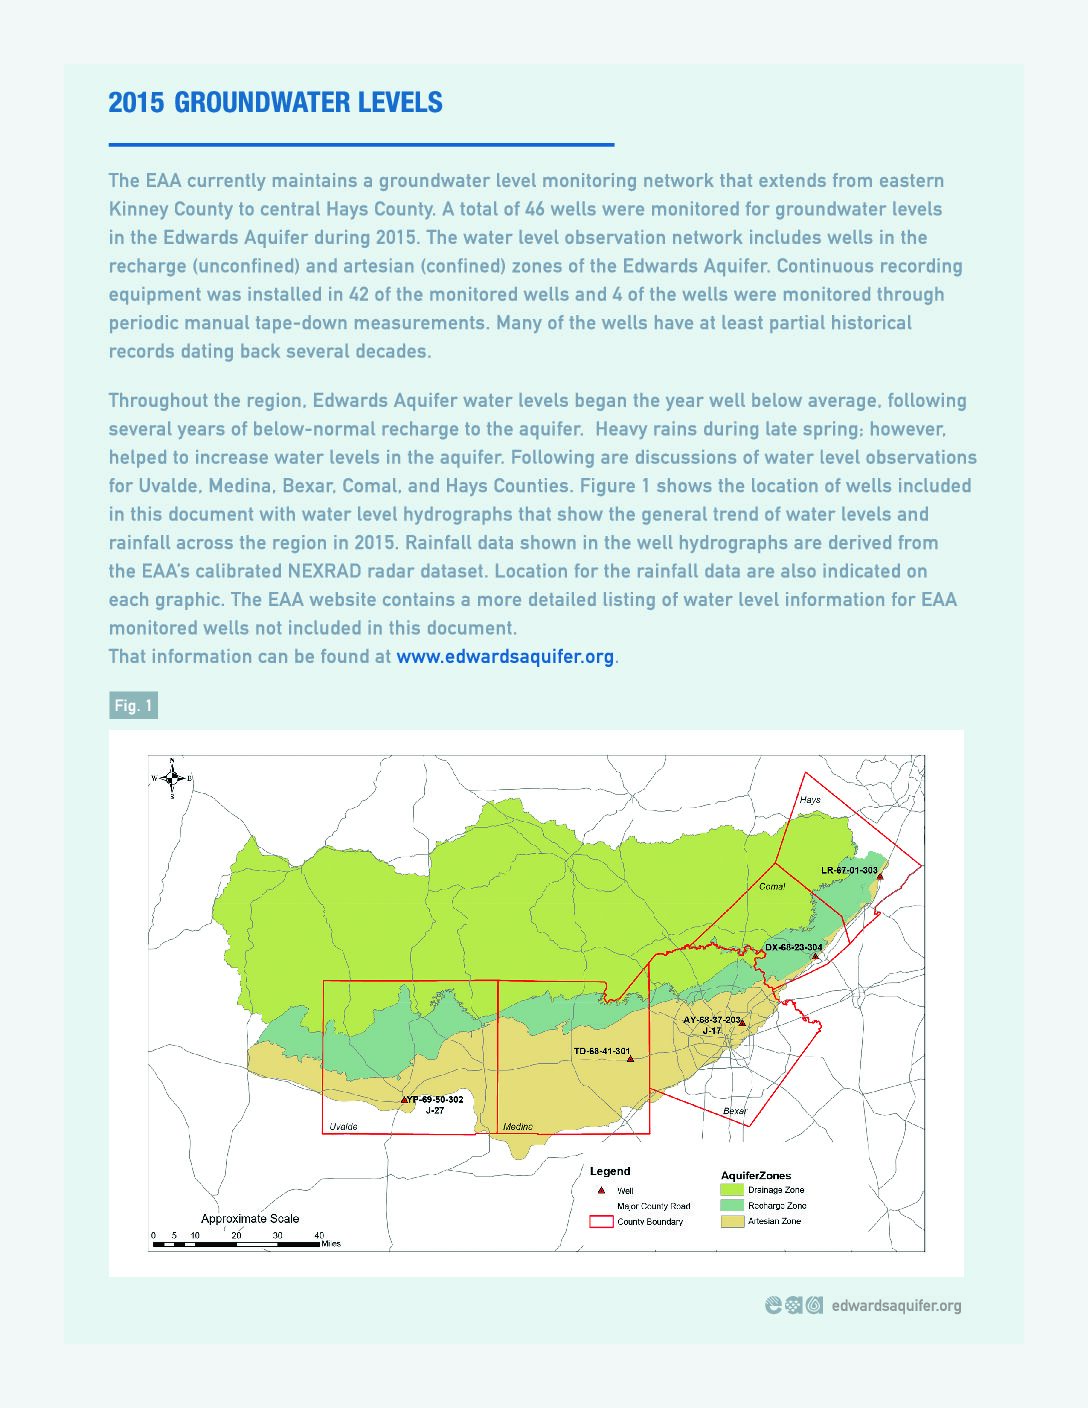
Edwards Aquifer Authority Hydrologic Data Report for 2015 Groundwater
Description: Annual report for 2015 on recharge, discharge, water levels and water quality in the Edwards Aquifer San Antonio Region
Report Number: 15-01
Location: Edwards Aquifer - San Antonio Area
Summary:This report presents results of the Edwards Aquifer Authority's (EAA's) Edwards Aquifer Data Collection Program for calendar year 2014. The report also provides a summary of events that were considered significant and that may have affected the Edwards Aquifer during the year. During 2015, the EAA collected a wide variety of Edwards Aquifer related data, including
*Groundwater level data;
*Precipitation measurement data;
*Groundwater recharge data;
*Groundwater discharge and usage data; and
*Water quality data from groundwater, surface water, and springs.
Records of Ground-Water Recharge, Discharge, Water Levels and Chemical Quality of Water for the Edwards Aquifer in the San Antonio Area, Texas, 1934-82.
Description: Compilation of Hydrologic Data for the Edwards Aquifer, San Antonio Area, Texas, 1982, with 1934-82 Summary. Annual hydrologic report issued by the Edwards Underground Water District.
Report Number: Bulletin 42
Location: Edwards Aquifer - San Antonio Area
Summary:The average annual ground-water recharge to the Edwards aquifer in the San Antonio area, Texas, from 1934 through 1982, was 608,400 acre-feet. The recharge in 1982 was 417,700 acre-feet. A maximum annual recharge of 1,711,200 acre-feet occurred in 1958, and a minimum annual recharge of 43,700 acre-feet occurred in 1956.
The calculated annual discharge by wells and springs in 1982 was 786,400 acre-feet. Annual discharge by wells and springs ranged from a maximum of 960,900 acre-feet in 1977 to a minimum of 388,800 acre-feet in 1955. The annual discharge by wells was 453,100 acre-feet in 1982, which is the second highest discharge for the 1934-82 period of record.
Although water levels in many of the wells in the Edwards aquifer fluctuated near the midpoint between record high and low levels during the summer of 1982, the volume of ground water in storage in the aquifer was above average for most of the year.
Analyses of water samples from 56 wells and 3 springs show that the water is of a significantly better quality than the level established for public water systems. However, trace concentrations of organic compounds were detected in some of the analyses.
Edwards Aquifer Authority Hydrologic Data Report for 2014
Description: Annual report for 2014 on recharge, discharge, water levels and water quality in the Edwards Aquifer San Antonio Region
Report Number: 15-01
Location: Edwards Aquifer - San Antonio Area
Summary:This report presents results of the Edwards Aquifer Authority's (EAA's) Edwards Aquifer Data Collection Program for calendar year 2013. The report also provides a summary of events that were considered significant and that may have affected the Edwards Aquifer during the year. During 2014, the EAA collected a wide variety of Edwards Aquifer related data, including
*Groundwater level data;
*Precipitation measurement data;
*Groundwater recharge data;
*Groundwater discharge and usage data; and
*Water quality data from groundwater,
surface water, and springs.
Records of Ground-Water Recharge, Discharge, Water Levels and Chemical Quality of Water for the Edwards Aquifer in the San Antonio Area, Texas, 1934-81.
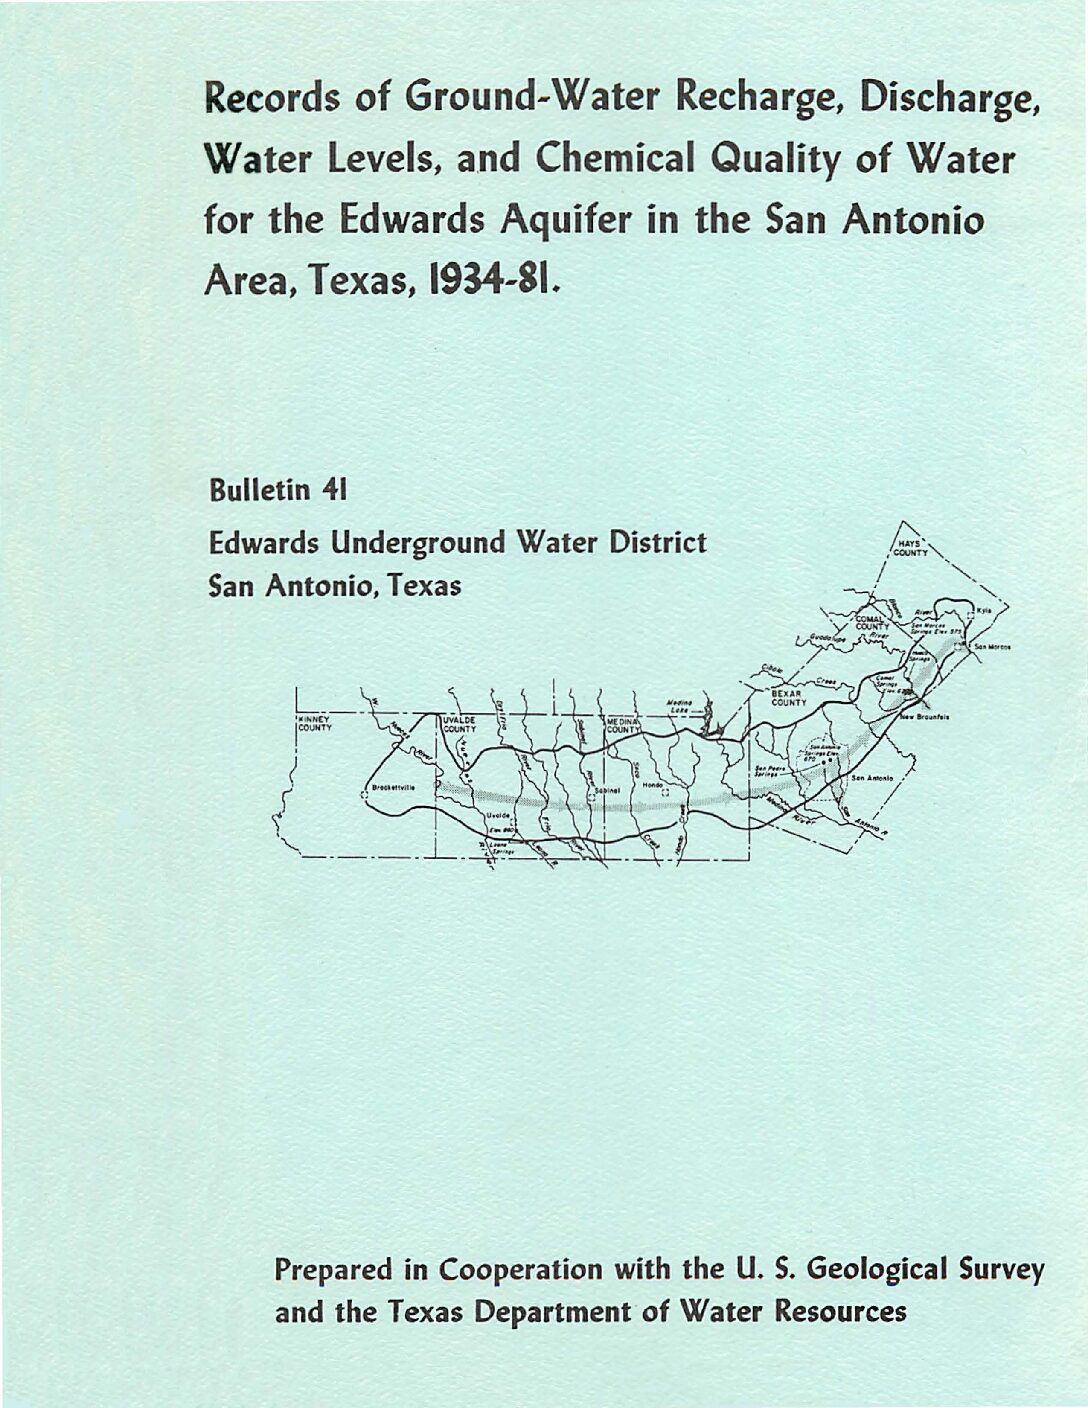
Description: Compilation of Hydrologic Data for the Edwards Aquifer, San Antonio Area, Texas, 1981, with 1934-81 Summary. Annual hydrologic report issued by the Edwards Underground Water District.
Report Number: Bulletin 41
Location: Edwards Aquifer - San Antonio Area
Summary:The average annual ground-water recharge to the Edwards aquifer in the San Antonio area, Texas, from 1934 through 1981, was 612,400 acre-feet. The recharge in 1981 was 1,448,400 acre-feet, which is the third highest annual recharge since 1934. A maximum annual recharge of 1,711,200 acre-feet occurred in 1958, and a minimum annual recharge of 43,700 acre-feet occurred in 1956.
The calculated annual discharge by wells and springs in 1981 was 794,400 acre-feet. Annual discharge by wells and springs ranged from a maximum of 960,900 acre-feet in 1977 to a minimum of 388,800 acre-feet in 1955. The annual discharge by wells was 387,100 acre-feet in 1981. Although water levels in many of the wells in the Edwards aquifer fluctuated near the midpoint between record high and low levels during the first 5 months of 1981, the volume of ground water in storage in the aquifer was above average for most of the year.
Analyses of water samples from 56 wells and 3 springs show that the water is of a significantly better quality than the level established for public water systems.
Edwards Aquifer Authority Hydrologic Data Report for 2015 Precipitation
Description: Annual report for 2015 on recharge, discharge, water levels and water quality in the Edwards Aquifer San Antonio Region
Report Number: 15-01
Location: Edwards Aquifer - San Antonio Area
Summary:This report presents results of the Edwards Aquifer
Authority's (EAA's) Edwards Aquifer Data Collection
Program for calendar year 2014. The report also provides
a summary of events that were considered significant
and that may have affected the Edwards Aquifer during
the year. During 2015, the EAA collected a wide variety
of Edwards Aquifer related data, including
*Groundwater level data;
*Precipitation measurement data;
*Groundwater recharge data;
*Groundwater discharge and usage data; and
*Water quality data from groundwater,
surface water, and springs.
Records of Ground-Water Recharge, Discharge, Water Levels and Chemical Quality of Water for the Edwards Aquifer in the San Antonio Area, Texas, 1934-80.
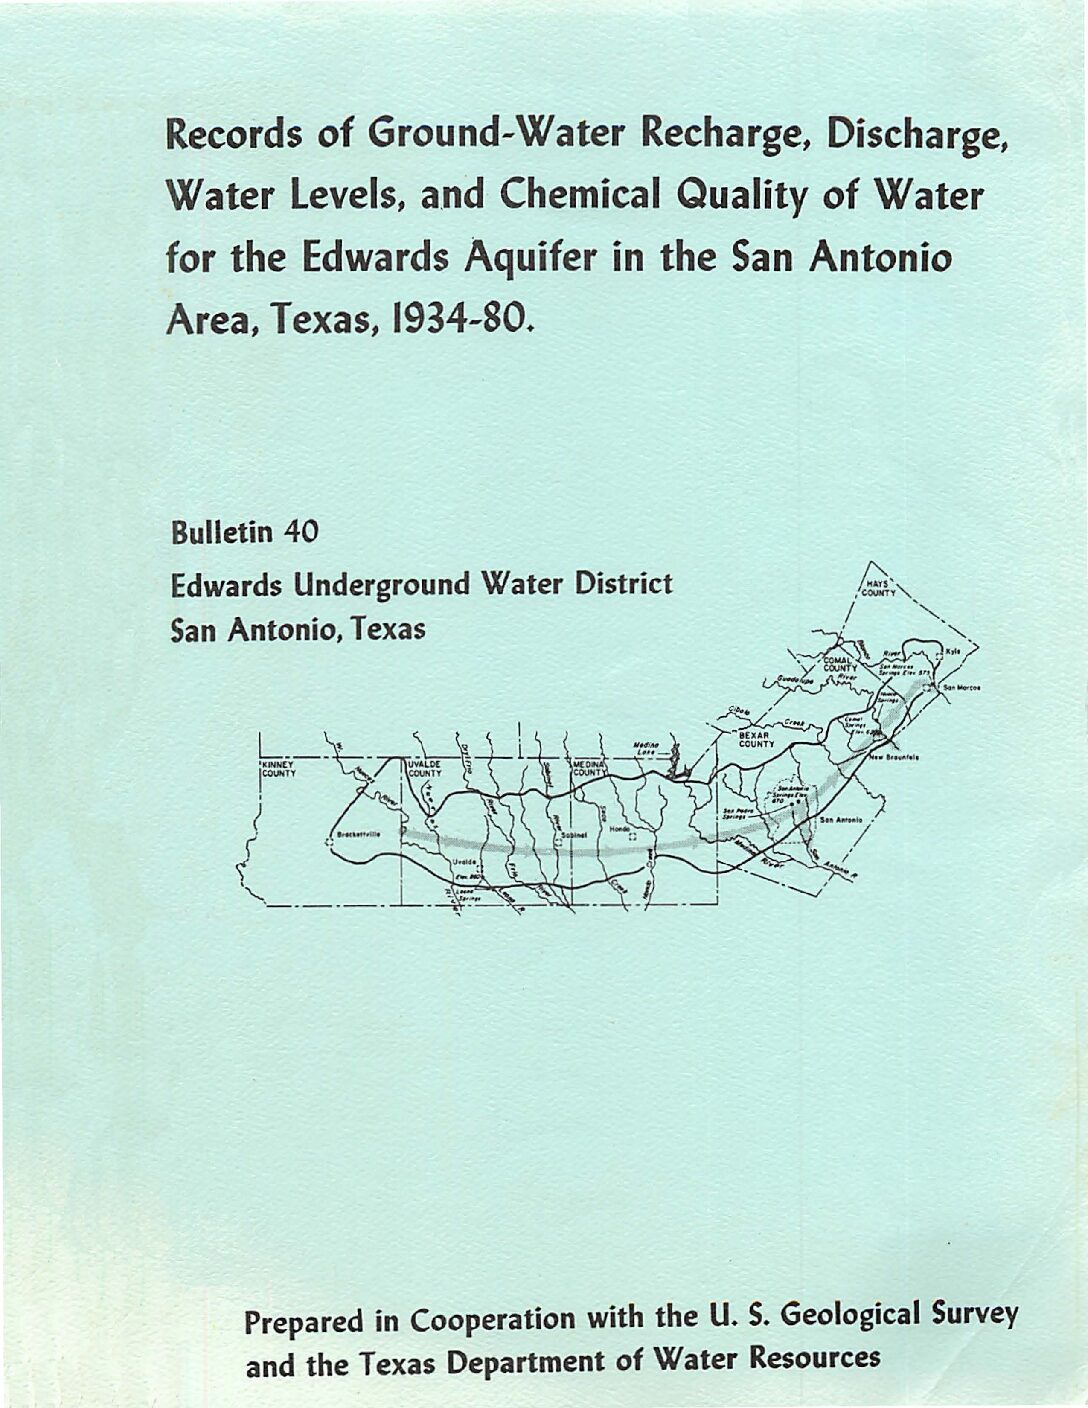
Description: Compilation of Hydrologic Data for the Edwards Aquifer, San Antonio Area, Texas, 1934-80. Annual hydrologic report issued by the Edwards Underground Water District.
Report Number: Bulletin 40
Location: Edwards Aquifer - San Antonio Area
Summary:The average annual ground-water recharge to the Edwards aquifer in the San Antonio area, Texas, from 1934 through 1980, was 594,800 acre-feet. The recharge during 1980 was 406,400 acre-feet . A maximum annual recharge of 1,711,200 acre-feet occurred during 1958, and a minimum annual recharge of 43,700 acre-feet occurred during 1956.
The estimated annual discharge by wells and springs during 1980 was 819,400 acre-feet. A maximum annual discharge of 960,900 acre-feet occurred during 1977 , and a minimum annual discharge of 388,800 acre-feet occurred during 1955. The annual discharge by wells was 491,100 acre-feet during 1980, which i s a record high for 1934- 80.
Although water levels in many of the wells in the Edwards aquifer fluctuated near the midpoint between record high and low levels during the last 6 months of 1980, the volume of ground water in storage in the aquifer was above average.
Analyses of water samples from 61 wells and 3 springs· show that the water is of a significantly better quality than the level established for public water systems.
Records of Precipitation, Aquifer Head, and Ground-Water Recharge to the Edwards and Associated Limestones, 1960-62, San Antonio Area, Texas
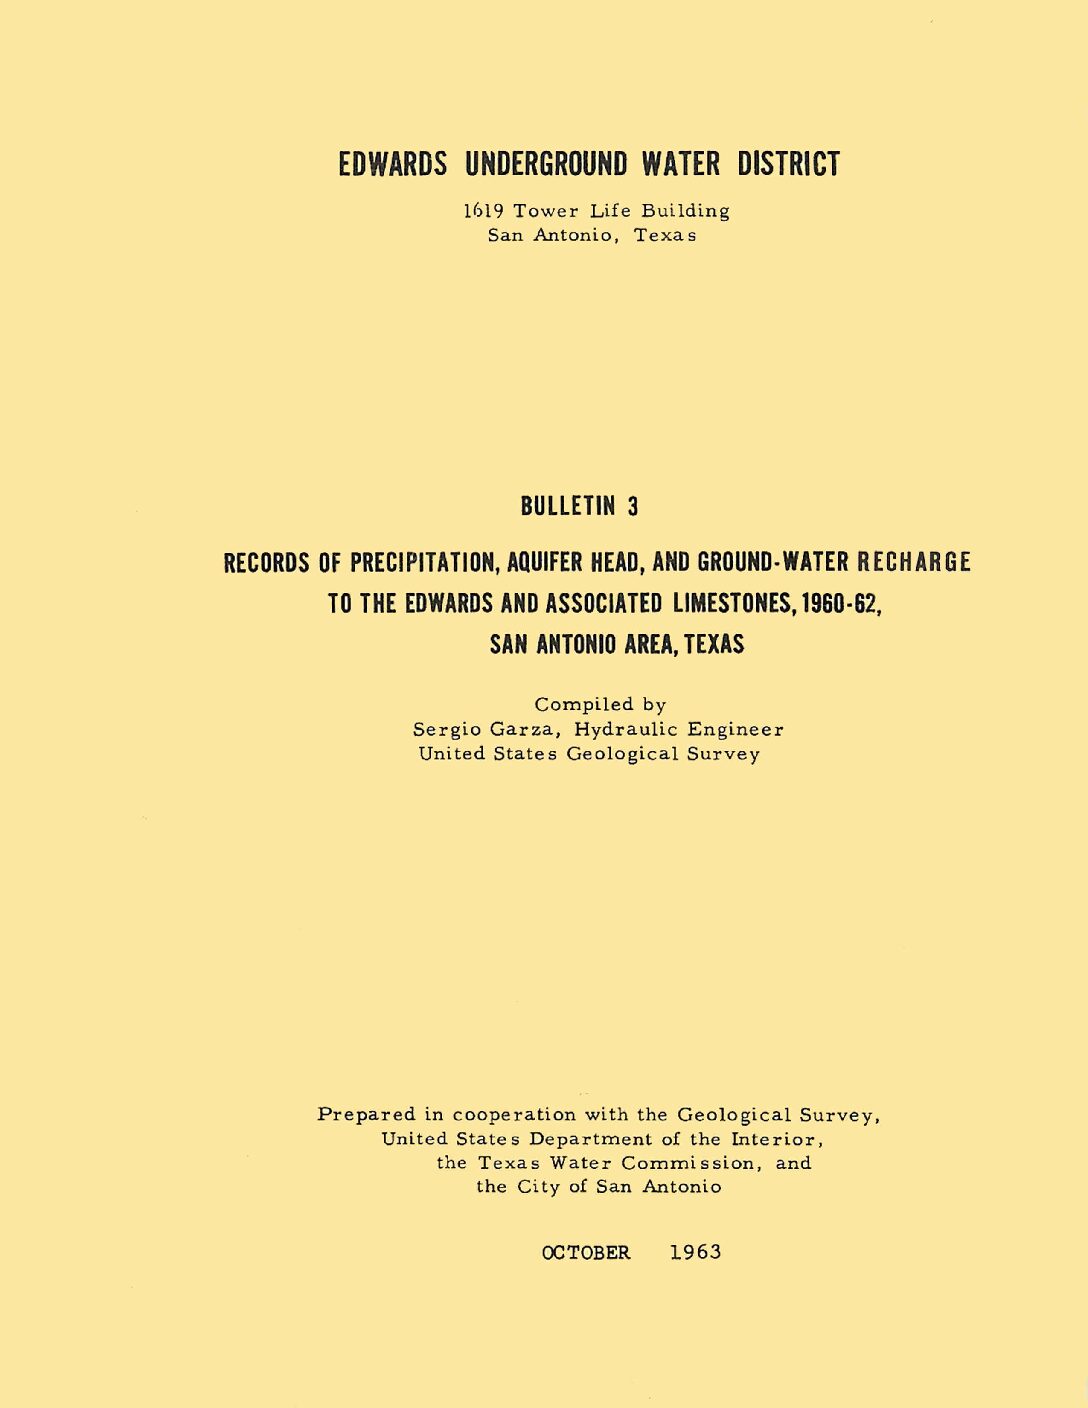
Description: Annual report for 1960-62 on precipitation, aquifer levels, and recharge to the Edwards Aquifer issued by the Edwards Underground Water District
Report Number: Bulletin 3
Location: Edwards Aquifer Balcones Fault Zone San Antonio Segment
Summary:Records of precipitation in the San Antonio area and water level data of the Edwards and associated limestones, the principal aquifer in the area, have been gathered for many years and incorporated in many geologic and hydrologic reports. The recent reports by Petitt and George (1956) and Garza (1962), which summarize all data through 1959, also include estimates of ground-water recharge. The collection of these records is part of the hydrologic investigation being made by the U. S. Geological Survey in cooperation with the Edwards Underground Water District, the Texas Water Commission, and the city of San Antonio.
Records of annual precipitation at selected stations throughout the San Antonio area for the period 1960-62 are shown in table 1. Also included is the annual average for each of the stations.
Rainfall during 1960 and 1961 generally was near the average throughout the San Antonio area. The annual rainfall in most of the area was below average in 1962, the first year of area-wide deficiency since the end of the recent drought of 1947-57.
Table 2 shows the annual recorded high and low- water levels in five key wells in the San Antonio area for the period 1960-62; the record high and record low for each well are shown also . Water levels in many wells were record highs in 1961 : the last year of above-average rainfall during the period 1957-62. The record lows occurred during the peak of the recent drought in 1956 and early 1957. Wells H-5-1 (Uvalde County) and G-49 (Comal County) are close to Leona Springs and Comal Springs, respectively, and their range of water-level fluctuation when the springs are flowing is not as great as in other wells distant from the springs.
Recharge to the Edwards and associated limestones is chiefly by seepage from streams crossing the outcrop of the aquifer along faulted and fractured zones. Basically, their charge is estimated from results of seepage studies made at different stages of the streams and from discharge measurements made at established gaging stations. Table 3 shows the monthly mean discharge at the gaging stations during October-December 1962; records for the period January 1960 through September 1962 have been published by the U. S. Geological Survey (Hendricks, 1961; United States Dept . of the Interior, Geological Survey-Water Resources Division, 1961 and 1962).
Estimates of recharge for the period 1960-62, shown in table 4, are based on the same concepts employed by Petitt and George (1956) and Garza (1962); table 4 also lists the annual average recharge in each basin for the period 1934-59 (Garza, 1962 , p. 12). Recharge was above average during 1960 and 1961, when rainfall was plentiful. The western part of the San Antonio area, where the major part of the recharge takes place, was particularly deficient in rainfall during 1962; thus, the recharge was only about half the annual average.
Records of Ground-Water Recharge, Discharge, Water Levels and Chemical Quality of Water for the Edwards Aquifer in the San Antonio Area, Texas, 1934-79.
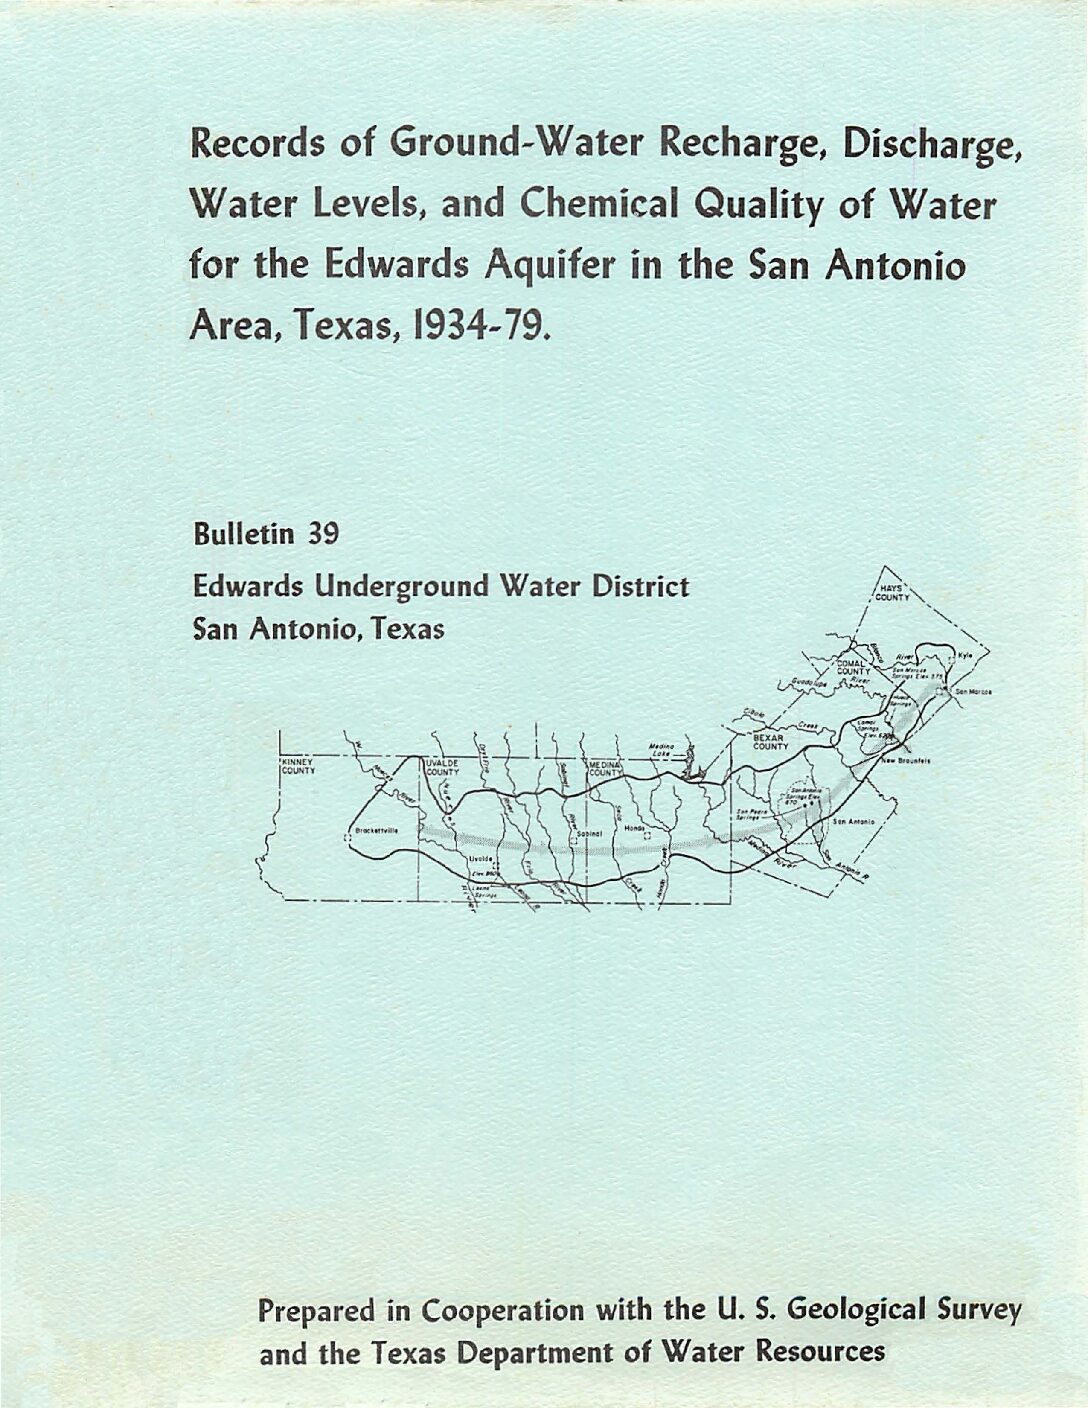
Description: Compilation of Hydrologic Data for the Edwards Aquifer, San Antonio Area, Texas, 1934-79. Annual hydrologic report issued by the Edwards Underground Water District.
Report Number: Bulletin 39
Location: Edwards Aquifer - San Antonio Area
Summary:The average annual ground-water recharge to the Edwards aquifer in the San Antonio area, Texas, from 1934 through 1979, was 598,800 acre-feet. The recharge in 1979 was 1,117,800 acre-feet, which was the fifth highest estimated recharge since 1934. A maximum annual recharge of 1,711,200 acre- feet occurred in 1958, and a minimum annual recharge of 43,700 acre-feet occurred in 1956.
The estimated annual discharge by wells and springs in 1979 was 914,500 acre-feet . A maximum annual discharge of 960,900 acre-feet occurred in 1977, and a minimum annual discharge of 388,800 acre-feet occurred in 1955.
During 1979, water levels in wells in the Edwards aquifer fluctuated near record highs; consequently, the volume of ground water in storage in the aquifer also was near the record high.
Analyses of water samples from 77 wells and 3 springs show no evidence of significant degradation of water quality in the Edwards aquifer, and the data show no trend of degradation in water quality.
Records of Ground-Water Recharge, Discharge, Water Levels and Chemical Quality of Water for the Edwards Aquifer in the San Antonio Area, Texas, 1934-78
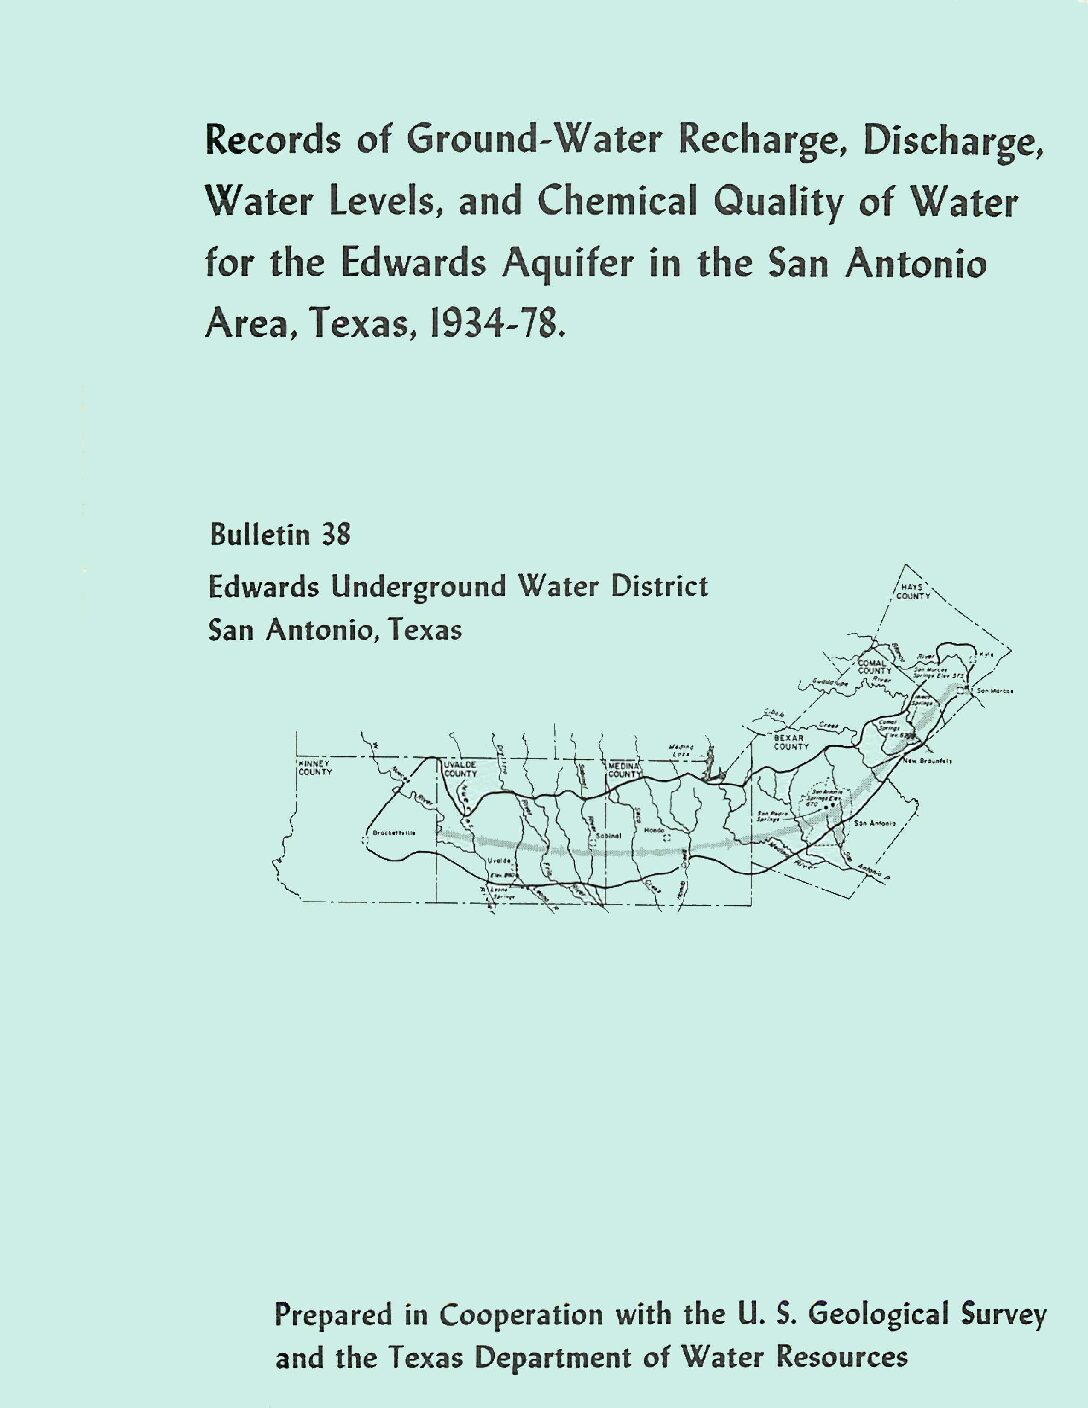
Description: Records of Ground-water Recharge and Discharge, 1934-78; Water Levels, 1975-78; and Chemical Quality of Water, 1977-78, for the Edwards Aquifer in the San Antonio Area, Texas. Annual hydrologic report issued by the Edwards Underground Water District.
Report Number: Bulletin 38
Location: Edwards Aquifer - San Antonio Area
Summary:The average -annual ground- water recharge to the Edwards aquifer in the San Antonio area, Texas, from 1934 through 1978 was 587,200 acre- feet. The recharge in 1978 was 502,500 acre-feet, ending a trend of above average recharge that began i n 1968. A maximum annual recharge of 1,711,200 acre- feet occurred in 1958, and a minimum annual recharge of 43,700 acre-feet occurred in 1956.
A maximum annual discharge of 960,900 acre- feet occurred in 1977, and a minimum annual discharge of 388,800 acre- feet occurred in 1955. The maximum annual discharge by wells was 431,800 acre- feet in 1978, which is a record high for the 1934-78 period.
Although water levels in wells in the Edwards aquifer showed a general decline in 1978, the volume of ground water in storage in the aquifer was above average.
Analyses of water samples from 72 wells and 3 springs show no evidence of significant degradation of water quality in the Edwards aquifer, and the data show no trend of degradation in water quality.
Use of landsat thematic mapper data to identify crop types and estimate irrigated acreage, Uvalde and Medina Counties, Texas, 1991
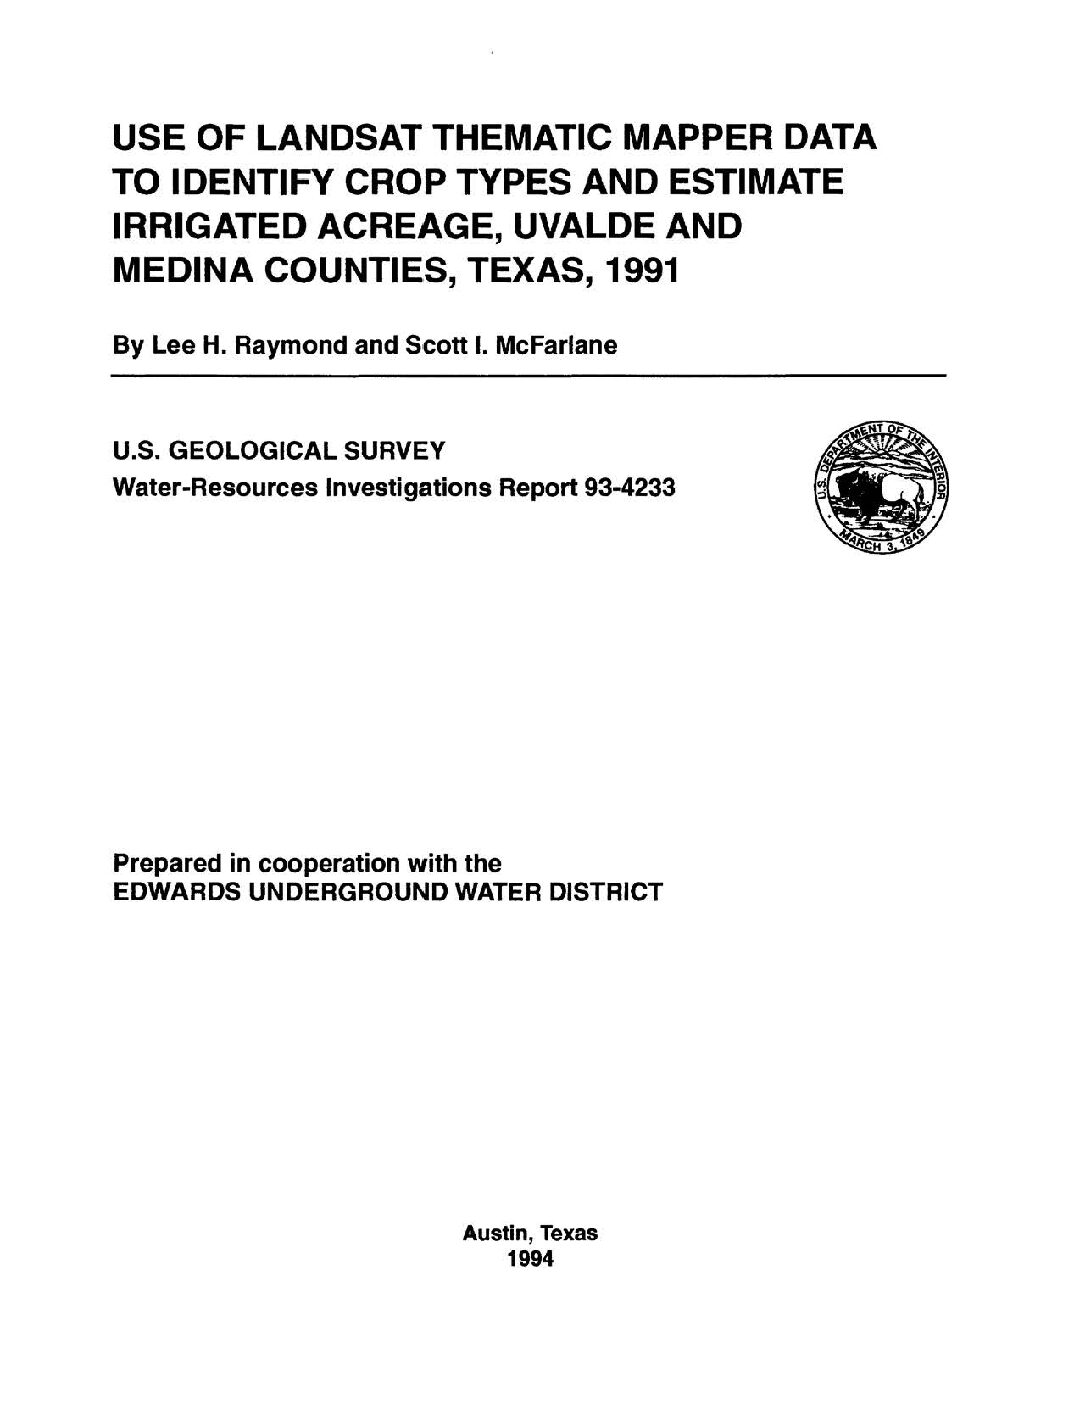
Description: Using the landsat thematic mapper to estimate total irrigated acreage and acre-feet of irrigation water for Uvalde and Medina Counties in 1991
Report Number: USGS WRIP 93-4233
Location: Uvalde County, Medina County
Summary:Landsat Thematic Mapper (TM) data were used to estimate that about 51,000 acres of crops were irrigated with water pumped from the Edwards aquifer in Uvalde and Medina Counties, Texas in 1991. Bands 2, 3, 4, and 5 from a TM image for August 10, 1991, were classified using the maximum-likelihood, unsupervised-classification procedure to identify the areas of crops irrigated in the two counties. Detailed vegetation distribution maps of two calibration sites in the study area, and boundaries of the areas probably irrigated in 1991, were used to interpret the results and to separate probable irrigated areas by county from the rest of the image.
Areas calculated for irrigated crops were 31,000 acres for Uvalde County, about 35 percent less than the area calculated using Landsat multispectral scanner (MSS) data in 1989, and 20,000 acres for Medina County, about 13 percent less than in 1989, a total decrease of about 28 percent for the two counties. Quantities of water pumped from the Edwards aquifer to irrigate crops in 1991 were estimated as 65,000 acre-feet for Uvalde County and 18,000 acre-feet for Medina County, a total decrease of about 56 percent from the value calculated using crop acreages from MSS data for 1989. Differences were attributed primarily to greater precipitation in 1991 than in 1989, resulting in smaller irrigation water requirements and less supplemental irrigation in 1991. Differences between results from 1989 and 1991, and between results from Uvalde and Medina Counties in 1991, were attributed primarily to greater precipitation in 1991, particularly in Medina County.
The total number of acres of irrigated crops estimated using Landsat TM data was about 9 percent lower in Uvalde County and about 13 percent lower in Medina County than the number of acres calculated from data reported by the U.S. Department of Agriculture, Agricultural Stabilization and Conservation Service (ASCS). The total quantity of water pumped from the Edwards aquifer for irrigation in the two counties in 1991, about 83,000 acre-feet, was about 5 percent greater than the quantity calculated from data reported by the ASCS.


