 Conditions
Science & Data Document Library
Science and Data Resources
Conduits and Turbulent Flow in the Edwards Aquifer
Description: Description of the Edwards Aquifer Balcones Fault Zone as a typical karst aquifer and recommendations for locations of conduits in the MODFLOW model
Location: Edwards Aquifer, Balcones Fault Zone
Summary:The purpose of this study was to address the existence of aquifer-scale conduit networks in the Edwards Aquifer and how they could be incorporated in the model of the aquifer constructed by the U.S.G.S. The study was completed in April 2004 by Stephen Worthington of Worthington Groundwater, Toronto, Ontario, Canada. (Report is dated December 2003.)
This report has recommendations for locations of conduits in the Edwards Aquifer Balcones Fault Zone based on tests conducted from a literature review.
[Excerpts from the report:]
Over the period 2000-2003 the US Geological Survey developed a new numerical model to simulate flow in the San Antonio segment of the Edwards Aquifer. In the early stages of this process the question arose as how to best incorporate into the model the high permeability found in some areas of the aquifer. It has generally been recognized that the high permeability in the Edwards Aquifer is due to dissolution of the limestone bedrock (Maclay, 1995), and Halihan et al. (2000) concluded that conduits control regional-scale permeabilities and have turbulent flow (Halihan et al., 2000, p. 129). If the location and characteristics of conduits could be either predicted on theoretical evidence or determined from aquifer measurements then this would offer the possibility of incorporating the conduits into the model and thereby produce a more accurate representation of the aquifer. This would be especially true if the conduits are organized into an aquifer-scale network. On the other hand the possibility was raised that conduits might only be local features, and that the aquifer might behave like a porous medium at a large scale. This raised three important questions:
a) What are the characteristics of aquifer-scale conduit networks?
b) What tests can be applied to determine whether there are aquifer-scale conduit networks in the Edwards Aquifer?
c) where might such conduit networks be located and how could they be incorporated in the USGS numerical model?
The median lag between rainfall and maximum water level was 60 days, but there is much variability.[There were] two distinct responses in the aquifer. A few wells in the recharge zone together with Comal and San Marcos Springs show a rapid and large response, with peak levels being reached within a few days of the storm. The peak responses in the springs are driven by high heads in the conduits that feed the springs, with the pressure pulse from the increased water levels in the recharge zone being transmitted quickly to the springs. Conversely, most wells show a much slower and smaller response, with peak water levels being attained after about two months. These wells are not located on conduits and their response is attenuated by the much lower permeability in the matrix and smaller fractures in the aquifer.
Comparison between the Edwards Aquifer and other karst aquifers shows that the scaling effect is similar (Figure 11). The implication is that the Edwards is similarly karstified to other karst aquifers and thus has a well-developed conduit network.
Each of the six tests provides evidence that flow in the Edwards Aquifer is more like an ideal karst aquifer than an ideal porous medium aquifer. This strongly supports the concept that there is an integrated network of conduits connecting the major sinking streams with the springs
[The conclusion] recommended location of conduits for the USGS MODFLOW model.
1985 Hydrologic Data Report Compilation of Hydrologic Data for the Edwards Aquifer, San Antonio Area, Texas, 1985, with 1934-85 Summary
Description: Annual report for 1985 on recharge, discharge, water levels and water quality in the Edwards Aquifer San Antonio Region. Note: Largeformat versions of the plates for this report are available at: https://www.edwardsaquifer.org/wp-content/uploads/2019/05/1987_Ozuna-etal_1985HydrologicData.pdf.
Report Number: Bulletin 45
Location: Edwards Aquifer - San Antonio Area
Summary:The average annual ground-water recharge to the Edwards aquifer in the San Antonio area, Texas, from 1934 through 1985 was 604,500 acre-feet. Recharge in 1985 was 1,003,300 acre-feet, which is the seventh highest estimated annual recharge since 1934. A maximum annual recharge of 1,711,200 acre-feet occurred in 1958, and a minimum annual recharge of 43,700 acre-feet occurred in 1956.
The calculated annual discharge by wells and springs in 1985 was 856,500 acre-feet. Annual discharge by wells and springs ranged from a maximum of 960,900 acre-feet in 1977 to a minimum of 388,800 acre-feet in 1955. In 1985, the annual discharge by wells was 522, 500 acre-feet. This is near the record high of 529,800 acre-feet in 1984.
Although water levels in many of the wells fluctuated near or above the midpoint between record high and low levels in 1985, the volume of ground water in storage in the aquifer was near average during most of the year. In 1985, substantial increases occurred during the fall and winter, and water levels then remained above average in most of the area.
Analyses of water samples from 94 wells and 3 springs in the Edwards aquifer show that the water quality in the freshwater zone is significantly better than the level established for public water systems. However, trace concentrations of organic compounds were detected in many of the analyses. Analyses of water samples collected from nine wells in Uvalde County showed concentrations of tetrachloroethylene in excess of 5 micrograms per liter. In 1985, samples were collected from wells along the bad-water line to detect changes in water quality as the potentiometric head in the Edwards aquifer changed.
Note: Largeformat versions of the plates for this report are available at:
https://www.edwardsaquifer.org/wp-content/uploads/2019/05/1987_Ozuna-etal_1985HydrologicData.pdf.
Recharge and Recirculation / Edwards Aquifer Optimization Program Phase III / IV Report Final
Description: Continued and final analyses using improved flow model and recent agency rules for optimizing recharge and streamflow in the Edwards Aquifer
Location: Edwards Aquifer, Balcones Fault Zone, Comal Springs, San Marcos Springs, San Antonio Pool
Summary:The R&R Phase III/IV Report consists of baseline modeling scenarios, evaluation of R&R facility operational parameters, evaluation of source water availability, scenario modeling, and engineering and cost estimates for seven scenarios.
[Excerpted from the Executive Summary and Summary]
For more than three decades, the Edwards Aquifer Authority (EAA), its predecessor, and others have evaluated groundwater management strategies to more productively use the shared resource of the Edwards Aquifer. These strategies have involved, among others, enhancing natural recharge and recirculating groundwater discharge back into the aquifer system. This study builds on previous investigations and reevaluates recharge and recirculation (R&R) strategies incorporating:
*analysis with an improved computer flow model,
*updated estimates of available source water, and
*recentlyadopted EAA rules for various aspects of aquifer management.
The study also evaluates combinations of strategies and provides preliminary costs for facilities to support implementation of an R&R program. Benefits to the region are evaluated in terms of increased water supply and maintaining minimum springflow at key springs including Comal and San Marcos springs.
Based on the analyses provided in this report, the following conclusions can be made.
*An R&R program can be developed that increases water supply while maintaining minimum required springflow.
*Considerations for optimizing the program should be based on specific management objectives developed by EAA and stakeholders such as when and under what conditions additional water supply is needed and what minimum flows are required for Comal Springs and during what time period.
*Using the water balance output from the model, benefits from enhanced recharge can be assessed for five main categories: enhanced pumping (for recharge recovery), Permit pumping (due to lessening of CPM stages), Comal Springs, springflow at other springs, and aquifer storage (water remaining in aquifer).
*Baseline conditions developed for this study indicate that the aquifer is in critical period stages for most of the model time period. For the San Antonio Pool, critical period stages occur 65 percent of the time. Springflow at Comal Springs is significantly lower than the historical record and ceases to flow for 25 months during the drought of record (19471956).
*The EAA model, as modified, simulates newlyadopted CPM rules and pumping cap, and provides a valuable tool for evaluating R&R scenarios.
1983-84 Hydrologic Data Report Compilation of Hydrologic Data for the Edwards Aquifer, San Antonio Area, Texas, 1983-84, with 1934-84 Summary
Description: Annual report for 1983-84 on recharge, discharge, water levels and water quality in the Edwards Aquifer San Antonio Region
Report Number: Bulletin 43-44
Location: Edwards Aquifer - San Antonio Area
Summary:The average annual ground-water recharge to the Edwards aquifer in the San Antonio area, Texas, for 1934-83 and 1934-84, was 604,700 and 596,700 acre-feet, respectively. Annual recharge for 1983 and 1984 was significantly below the average annual recharge. The recharge in 1983 was 420,100 acre-feet. Recharge in 1984 was 197,900 acre-feet, which is the ninth lowest estimated annual recharge since 1934. A maximum annual recharge of 1,711,200 acre-feet occurred in 1958, and a minimum annual recharge of 43,700 acre-feet occurred in 1956.
The calculated annual discharge by wells and springs in 1983 and 1984 was 720,100 and 702,300 acre-feet, respectively. Annual discharge by wells and springs ranged from a maximum of 960,900 acre-feet in 1977 to a minimum of 388,800 acre-feet in 1955. The annual discharge by wells was 418,600 acre-feet in 1983. In 1984, the annual discharge by wells was 529,800 acre-feet, which is a record high for the 1934-84 period of record.
Although water levels in many of the wells fluctuated near or below the midpoint between record high and low level s in 1983, the volume of ground water in storage in the aquifer was above average during most of the year. In 1984, substantial declines occurred during the spring and summer, and water levels then fluctuated below average conditions in most of the wells. Water levels in many of the wells fluctuated just above the 1956 record low during the summer. The volume in storage in the aquifer was below average during most of 1984.
Analyses of water samples from 158 wells and 3 springs in the Edwards aquifer show that the water in the freshwater zone is of a significantly better quality than the level established for public water systems. However, 62 percent of samples from 77 wells and 3 springs contained 1 or more organic compounds. Analyses of water samples collected from six wells in Bexar and Uvalde Counties showed concentrations of tetrachloroethylene in excess of 5 micrograms per liter. In 1984, samples were collected from wells along the bad-water line to detect changes in water quality as the potentiometric head in the
Edwards aquifer changed.
Edwards Aquifer Authority Hydrologic Data Report for 2011
Description: Annual report for 2011 on recharge, discharge, water levels and water quality in the Edwards Aquifer San Antonio Region
Report Number: 4-Dec
Location: Edwards Aquifer-San Antonio Region
Summary:(Excerpted from the report Summary)
This report presents results of the Edwards Aquifer Authority's (EAA's) Edwards Aquifer Data Collection Program for calendar year 2011.
Water levels at the Bexar County (J-17) index well were below the historical mean for most of the year.Other wells in the region exhibited similar behavior with regard to lower than normal water levels.Precipitation in the Edwards Aquifer region for 2011 was below that of the period of record (1934“2011). In general, the region received between 50 and 60 percent of mean (or normal) precipitation during the year.In 2011, total groundwater discharge from the Edwards Aquifer through wells and springs was estimated at 692,870 acre-feet. This amount is below the median total discharge of 699,200 acre-feet for the period of record (1934“2011). Discharge from wells in 2011 was estimated to be 427,653 acre-feet, almost 100,000 acre-feet above the 327,500 acre-foot period of record (1934“2011) median.Discharge from springs in 2011 was estimated at 265,217 acre-feet, significantly below the period of record median of 384,200 acre-feet.
Analytical testing for the following compounds was performed: bacteria, nutrients, volatile organic compounds (VOCs), semivolatile organic compounds (SVOCs), metals, pesticides, herbicides, polychlorinated bi-phenyls (PCBs), and limited analyses for personal care and pharmaceutical products (PPCPs). Whereas most sample results did not indicate anthropogenic impacts at the sample point, some compounds of concern were detected at low concentrations in various wells and springs and one surface water sample.[None of the detections were in excess of the applicable regulatory standards. Samples collected at springs indicated some detections of VOCs, SVOCs, pesticides, herbicides, metals, and one PCB, indicat[ing] the possibility of anthropogenic impacts.Detections included one PCB compound in a sample from Comal Springs at a concentration above the regulatory limit.Four VOC detections were noted out of 78 spring samples (five percent), and seven pesticide detections in 77 samples (nine percent). Arsenic was detected above the regulatory limit in one Comal Springs sample, as was antimony in a Blanco River sample.
Personal care and pharmaceutical product sampling performed in 2011 provided some insight into the presence of these compounds in groundwater. In the five wells and one spring sampled, only one well was nondetect with regard to these compounds. Unlike other analytical results previously discussed, PPCP analyses are performed such that these compounds are detected at nanogram per liter (ng/L) concentrations or parts per trillion. Therefore, the detections noted were all at very low concentrations. The types of PPCP compounds detected were estrogen hormones (one well and at Comal Springs), antibiotics (four wells), an antibacterial soap ingredient (one well), and nicotine metabolite (one well). Note that at the time of testing for these compounds, no regulatory standards existed for their presence in drinking water. Concentrations for detected PPCP compounds ranged from 0.31 to 6.9 ng/L.
The most significant event affecting the Edwards Aquifer during the year was the record-setting drought that affected the entire state as well as the Edwards Aquifer region. According to the state climatologist, the period October 2010 through September 2011 was the driest 12-month period on record for the state. Extremely low rainfall amounts were exacerbated by higher than normal temperatures and frequent high winds across the state. The aquifer received approximately 20 percent of normal recharge for the year. However, the drainage basins that recharge Kinney, Uvalde, and Medina counties received only about ten percent of normal recharge for the year. Dry conditions and lack of recharge caused aquifer levels to drop throughout most of the year, resulting in mandatory water conservation measures across the region.
Analysis of Recharge and Recirculation Edwards Aquifer Phase 1
Description: Testing the MODFLOW model with historical data of recharge and recirculation at two hypothetical recharge sites prior to release of the model
Location: Edwards Aquifer, Balcones Fault Zone
Summary:The concept of recharge and recirculation (R&R) for the Edwards Aquifer embodies the integrated use of groundwater, surface water, and storage units to optimize the availability of water for pumpers during drought periods and to accommodate water needs for endangered species in Comal and San Marcos springs. The purpose of this Phase 1 report is to outline work performed by Todd Engineers to evaluate various documents related to the concept of R&R and to document Todd Engineers review of a MODFLOW groundwater model of the Edwards Aquifer for use in simulating R&R scenarios. The report also discusses two preliminary R&R scenarios simulated with the model. Subsequent phases of the project will use the model to simulate numerous R&R scenarios to evaluate possible benefits for aquifer water levels and springflows.
[From Introduction of Phase 2 report]
In April 2004, Edwards Aquifer Authority (EAA) contracted with Todd Engineers to conduct a multi-phase study on enhanced recharge and recirculation (R&R) strategies. Phase 1 of that work was completed in September 2004. This Phase 1 report includes a review of existing studies, an analysis of Edwards Aquifer hydraulics, installation and operation of the 2004 U.S. Geological Survey (USGS) MODFLOW model of the Edwards Aquifer, and application of the model for test runs at two hypothetical recharge sites. Test runs indicated that long-term benefits measured in years can be achieved for Comal Springs flow by increasing aquifer recharge. Further, the magnitude and duration of increased springflow was found to vary significantly from site to site.
Edwards Aquifer Authority Hydrologic Data Report for 2005
Description: Annual report for 2005 on recharge, discharge, water levels and water quality in the Edwards Aquifer San Antonio Region
Report Number: 1-Jun
Location: Edwards Aquifer - San Antonio Area
Summary:This report presents the results of the Authority's Edwards Aquifer Data Collection Program for calendar year 2005.
Water levels remained above the historical mean value at the Bexar County (J-17) index well throughout 2005. Other wells in the region exhibited similar behavior. In 2005 aquifer (groundwater) levels remained above historical mean values but generally decreased for most of the year.Precipitation in the Edwards Aquifer region was below mean in 2005. However,rainfall in the drainage area (the northernmost counties in the region) was higher than that recorded within the recharge and artesian zones of the aquifer.
Total recharge to the Edwards Aquifer was 764,000 acre-feet in 2005, approximately 30 percent above the median of 585,700 acre-feet for the period of record (1934“2005).In calendar year 2005, groundwater discharge from the Edwards Aquifer through wells and springs totaled 1,035,700 acre-feet. This amount is approximately 52 percent above the median of 681,500 acre-feet for the period of record (1934“2004).Discharge from wells in 2005 was estimated to be 388,527 acre-feet, within approximately one percent of the 382,800 acre-foot ten-year median (1996“2005).Discharge from springs in 2005 was estimated to be 647,146 acre-feet, approximately 32 percent more than the ten-year mean of 488,500 acre-feet. For the period of record, 2005 experienced the second highest annual discharge from springs, exceeded only by the 1992 discharge value. Spring discharge for years 2005, 2004, 2003, and 2002 represents the second-, third-, fourth-, and fifth-highest discharge amounts for the period of record.
For well water samples collected in 2005, lead was detected at one location at 28.6 μg/L, well above the 15.0 μg/L MCL. Other metals detected include strontium, iron, and manganese at concentrations above their respective PCLs, or secondary standards. Surface and spring water sample analyses did not indicate the presence of any analyzed metals above their respective standards.
For samples collected in 2005, nitrate-nitrite as nitrogen concentrations ranged from below the laboratory reporting limit of 0.015 mg/L to 7.34 mg/L in samples from wells, streams, and springs in the Edwards Aquifer region.None of the samples collected exceeded the MCL of ten mg/L of nitrate as nitrogen.
One VOC was detected at or above its associated MCL in the 45 wells sampled. The compound tetrachloroethene (PCE) was detected at 30.5 μg/L in Bexar County well AY-68-36-1DR. The MCL for PCE is five μg/L. One additional VOC was detected in a well sample below the MCL in Bexar County.
Several VOC compounds were detected in San Marcos Springs during the March and November sample events. In 2005, 25 wells and six spring groups were sampled for SVOC's. The compounds phenol and n-nitroso-di-npropylamine were detected in well samples, whereas the compounds bis(2-ethylhexyl)adipate and benzoic acid were detected in spring water samples.
In 2005, samples from 38 wells and six spring groups were analyzed for herbicides, pesticides, and PCB's. No sample tested positive for these compounds. Edwards Aquifer water is generally of such high quality that it normally requires only chlorination to meet public drinking water standards. However, the detection of nitrates and organic compounds, as well as trace quantities of metals, in the aquifer is a concern, and the Authority will continue to monitor for these compounds to determine possible sources and trends. Nitrate as nitrogen was detected frequently in all sample types; however, well samples had the highest concentrations, with 31 of 95 wells sampled testing positive for nitrate-nitrite at 2.0 mg/L or higher. Five of the 95 wells had nitrate-nitrite concentrations above 5.0 mg/L; the MCL for nitrate-nitrite is 10 mg/L.
Confirmed detections of VOCs, such as PCE froma Bexar County well and 1,2,4-trimethylbenzene, xylene, and 1,2-dichloroethane at the San Marcos Springs, are a concern and warrant continued monitoring in the future. The Authority's aquifer wide water-quality sampling program will continue to monitor wells, streams, and springs for indications of water quality impacts throughout the region.
Analysis of Recharge and Recirculation Edwards Aquifer Phase 2
Description: Use of the MODFLOW model to examine recharge at eight sites in the Edwards Aquifer and discharge at San Marcos Springs
Location: Edwards Aquifer, Balcones Fault Zone
Summary:The Recharge and Recirculation (R&R) Phase 2 Report focuses on Edwards Aquifer responses to recharge as simulated by the Aquifer MODFLOW model. Using the model, aquifer water levels and springflows were evaluated by simulating recharge events at eight different locations across the project area. Numerous combinations of recharge timing, volume, and location were modeled. No specific source of recharge water was considered during Phase 2 analysis. The report contains numerous graphics to demonstrate the relative benefits of the scenarios modeled.
[Excerpted from the Executive Summary]
Phase 2 of the R&R study analyzed the magnitude and duration of increased springflow from enhanced recharge at eight sites considered for development by the South Central Texas Regional Water Planning Group (SCTRWPG, 2001). Objectives for Phase 2 included a comparison of impacts on a site-to-site basis for both a single recharge event and yearly enhanced recharge events over time.
These analyses were conducted with the application of the recently-available USGS MODFLOW model of the Edwards Aquifer (Lindgren, 2004). Given the uncertainties associated with the model and the approved scope of work, a series of model runs were devised to analyze the response of the aquifer and springflows to various scenarios of enhanced recharge. Subsequent model runs used actual estimates for maximum recharge enhancement water under average and drought conditions for the eight recharge sites as summarized by Turner Collie & Braden and LBG Guyton in their 1999 work for EAA (Table 5).,,,
Increases in springflow occur quickly in response to recharge because of the rapid transmission of the pressure wave in the aquifer. However, in most cases the actual water molecules that are recharged remain in the aquifer for a long time.
A summary of the preliminary findings of the Phase 2 analyses based on applications of the USGS MODFLOW model are briefly summarized as follows:
1. On a 5-year recharge basis, Comal Springs flow increases by an amount of water equivalent to 45 to 54 percent of water recharged from the Lower Sabinal, Lower Hondo, Lower Verde, San Geronimo, or Cibolo sites. The remaining sites, Indian Creek, Lower Frio, and Lower Blanco, are less effective in terms of benefits to Comal Springs (see Figure 2).
2. A flow increase in Comal Springs resulting from enhanced recharge at an individual site is independent of water recharged at any other site (see Table 2).
3. Year-round recharge yields more uniform springflow than does seasonal recharge
(see Figure 8).
4. On a continuing recharge basis, Comal Springs flow increases by 0.9 to 1.1 cfs for each 1,000 AF/yr of enhanced recharge into each of the Lower Sabinal, Lower Hondo, Lower Verde, San Geronimo, or Cibolo sites (see Table 3).
5. Tributary runoffs reaching Indian Creek and Lower Blanco recharge sites are the largest of the eight sites but contribute least to Comal Springs flow (see Table 5).
6. Well J-17 shows an increase in water level of about 0.2 foot for each 1,000 AF/yr of continuous recharge into the Lower Sabinal, Lower Hondo, Lower Verde, or San Geronimo sites.
7. Model results indicate that the observed Comal Springs drought of less than 185 days in 1956 would increase to 1,264 days of no flow under the hypothetical situation of 1950s recharge and 1980s pumpage (see Table 8). If all annual average available recharge were applied to a single site (Lower Verde), the no flow period would be reduced to 512 days, and if DMCPM rules were also in effect, the period would be further reduced to zero days.
Edwards Aquifer Authority Hydrologic Data Report for 2003
Description: Annual report for 2003 on recharge, discharge, water levels and water quality in the Edwards Aquifer San Antonio Region
Report Number: 2-Apr
Location: Edwards Aquifer - San Antonio Area
Summary:(Excerpted from the report Summary)
This report presents the results of the Authority's Edwards Aquifer Data Collection Program for calendar year 2003.
Water levels remained well above average at the Bexar County (J-17) index well throughout 2003. Other index wells in the region exhibited similar behavior. Precipitation in the Edwards Aquifer region was generally slightly below average in 2003, except in Hondo where precipitation exceeded the annual average by approximately 21 percent. The highest rainfall volumes were recorded in west central Real, central Bandera, central Medina, and southern Comal counties.
In 2003, total recharge to the Edwards Aquifer was 669,000 acre-feet. This recharge volume is approximately 20 percent above the median of 559,400 acre-feet for the period of record (1934-2003) and approximately four percent below the mean of 698,500 acre-feet for the period of record (1934-2003).
Nitrate as nitrogen concentrations ranged from below the laboratory reporting limit of concentrations were detected above 5.0 mg/L in five wells.
The volatile organic compound (VOC) tetrachloroethene (PCE) was detected in one well sample at a concentration equal to its MCL of 5.0 μg/L. PCE was not detected above the MCL in any of the samples collected in 2003.
The results of the 2003 water quality sampling indicate that water quality in the aquifer is generally excellent. Edwards Aquifer water is generally of such high quality that it normally requires only chlorination to meet public drinking water standards. However, the detection of trace quantities of metals and organic compounds in the aquifer is a concern and the Authority will continue to monitor for these compounds to determine possible sources and trends. Quantification of many of the metals and organic compounds at the low concentrations indicated in the report can be problematic and continued monitoring will be required to confirm their presence or absence.
The Authority's aquifer-wide water quality sampling program will continue to monitor wells, streams, and springs for indications of water quality impacts. Authority staff and cooperating agencies will continue to analyze any anomalous data and investigate possible sources of contamination.
Edwards Aquifer Authority Hydrologic Data Report for 2004
Description: Annual report for 2004 on recharge, discharge, water levels and water quality in the Edwards Aquifer San Antonio Region
Report Number: 2-May
Location: Edwards Aquifer - San Antonio Area
Summary:(Excerpted from the report Summary)
This report presents the results of the Authority's Edwards Aquifer Data Collection Program for calendar year 2004.
Water levels remained above the historical mean value at the Bexar County (J-17) index well throughout 2004. Other wells in the region exhibited similar behavior. Bexar County index well (J-17) reached the second highest water level on record, while monitoring wells in Comal and Hays counties achieved new record highs in 2004.
Precipitation in the Edwards Aquifer region was above mean in 2004, with rainfall amounts ranging from approximately 15 percent above mean in Uvalde County to over 50 percent above mean in Medina, Comal, and Hays counties.
Total recharge to the Edwards Aquifer was 2,176,100 acre-feet in 2004, approximately 388 percent above the median of 560,900 acre-feet for the period of record (1934-2004). Calendar year 2004 is the second highest annual recharge on record.
In calendar year 2004, groundwater discharge from the Edwards Aquifer through wells and springs totaled 937,324 acre-feet. This amount is approximately 38 percent above the median of 679,500 acre-feet for the period of record (1934-2004).
For samples collected in 2004, nitrate-nitrite as nitrogen concentrations ranged from below the laboratory reporting limit to 8.78 mg/L in samples from wells, streams, and springs in the Edwards Aquifer region.
One VOC was detected at or above its associated MCL in two wells. The compound tetrachloroethene (PCE) was detected at 20 μg/L in Bexar County well AY-68-36-601RS, and at 5 μg/L in Uvalde County well YP-69-51-114. The MCL for PCE is 5 μg/L. Additional detections of PCE occurred in five well samples from Bexar County ranging in concentration from 0.02(J, TB) μg/L to 0.8(J) μg/L. One additional SVOC, naphthalene, was detected in a spring sample at 1(J) μg/L.The data flag (J) combined with the other issues relative to these compounds indicates a low probability of contamination issues related to the listed compounds.
In 2004, samples from 23 wells and five spring groups were analyzed for herbicides, pesticides, and PCBs. None of the well samples tested positive for these compounds.No herbicides or PCBs were detected in the spring samples. Pesticide detections in spring samples areGamma ChlordaneAlpha BHC Gamma BHCDelta BHCHeptachlor
Edwards Aquifer water is generally of such high quality that it normally requires only chlorination to meet public drinking water standards. However, the detection of nitrates and trace quantities of metals and organic compounds in the aquifer is a concern and the Authority will continue to monitor for these compounds to determine possible sources and trends.
Nitrate as nitrogen was detected frequently with the highest concentrations detected in well water samples. Quantification of many of the metals and organic compounds at the low concentrations indicated in the report can be problematic and continued monitoring will be required to confirm their presence or absence. However, the confirmed detections of organic compounds such as PCE in Uvalde and Bexar counties is a concern, and warrants additional monitoring in the future.
The Authority's aquifer-wide water quality sampling program will continue to monitor wells, streams, and springs for indications of water quality impacts. Authority staff and cooperating agencies will continue to analyze any anomalous data and investigate possible sources of contamination.
Edwards Aquifer Authority Hydrogeologic Report for 2002
Description: Annual report for 2002 on recharge, discharge, water levels and water quality in the Edwards Aquifer San Antonio Region
Report Number: 2-Mar
Location: Edwards Aquifer - San Antonio Area
Summary:(Excerpted from the report Summary)
This report presents the results of the Authority's Edwards Aquifer Data Collection Program for calendar year 2002.
Throughout most of the year water levels exceeded average levels in the Authority's index wells in Uvalde, Hondo, and San Antonio. Below average precipitation in the late spring and early summer resulted in water levels falling to the level where water use restrictions would be required. Above average precipitation in late June and July was sufficient to recharge the aquifer and reduce demand, which moderated the typical seasonal decline of water levels for that time of year. Consequently, the Authority did not institute water use restrictions during the summer of 2002.Weather conditions during 2002 limited the number of days cloud seeding operations could be performed under the Authority's Precipitation Enhancement Program.
Total recharge to the Edwards Aquifer was 1,665,200 acre-feet in 2002, approximately 230 percent above average for the period of record (1934-2002). Only 1958, 1987, and 1992 experienced higher recharge volumes.The water level at J-17 reached a high for the year of 697.9 feet msl on November 10, 2002, representing the third highest annual maximum for the period of record for this well.
In 2002 discharge from the Edwards Aquifer through wells and springs totaled 997,100 acre-feet, which exceeded the average for the period of record (1934-2002). For the period of record, 2002 experienced the second highest annual discharge from springs, exceeded only by the 1992 discharge value. The above average precipitation, recharge, and aquifer water levels in 2002 resulted in the above average springflow.
Water samples from each sampling event were analyzed for major ions, metals, TDS, hardness, and nutrients. Water samples collected from 16 wells, the nine stream locations, and the five spring groups were also analyzed for pesticides and herbicides. Water samples from 27 wells and the five spring groups were also analyzed for volatile organic compounds (VOCs). Water samples from 11 wells and the five spring groups were also analyzed for semivolatile organic compounds (SVOCs).
For the samples collected in 2002, thallium was detected slightly above the MCL of 0.002 mg/L in water samples from seven wells, five of which are located in the saline zone. Two other metals, antimony and silver, were detected in three wells in the freshwater portion of the aquifer at concentrations slightly above their respective MCLs. Antimony was also detected at concentrations slightly above the MCL in three surface water and five spring water samples. Currently, no trends for these metals are indicated by the sample results; however, continued monitoring at these wells will indicate if any trends are developing.
For samples collected in 2002, nitrate concentrations ranged from below the laboratory reporting limit to 7.48 mg/L in samples from wells, streams, and springs in the Edwards Aquifer region. None of the samples collected exceeded the MCL of 10 mg/L for nitrate.
The herbicides ethoprop, silvex, and dicamba were detected in three well samples at 0.077 μg/L, 0.061 μg/L, and 0.09 μg/L, respectively. The herbicides ethoprop and atrazine were each detected in one stream sample at 0.076 μg/L and 0.10 μg/L, respectively. No herbicides were detected in spring water samples. The pesticide compounds lindane and diazinon were detected in one well sample at 0.01 μg/L and 0.014 μg/L respectively. The pesticide compound diazinon was detected in one stream sample.
Five well samples contained detectable concentrations of tetrachloroethene (PCE). Well YP-69-51-114, located in the City of Uvalde, contained PCE at 4.0 μg/L. The other four wells, located in Bexar County, contained PCE at concentrations ranging from 0.4 to 0.8 μg/L (concentrations less than the laboratory reporting limit). The MCL for PCE is 5.0 μg/L.
Water quality in the aquifer is generally excellent. Edwards Aquifer water is generally of such high quality that it normally requires only chlorination to meet public drinking water standards. However, the detection of VOCs and nitrate in the aquifer is a concern and the Authority will continue to monitor for these compounds to determine possible sources and trends. The Authority's aquifer-wide water quality sampling program will continue to monitor wells, streams, and springs for indications of water quality impacts. Authority staff and cooperating agencies will continue to analyze any anomalous data and investigate possible sources of contamination.
Edwards Aquifer Authority Hydrogeologic Report for 2001
Description: Annual report for 2001 on recharge, discharge, water levels and water quality in the Edwards Aquifer San Antonio Region
Report Number: 1-Feb
Location: Edwards Aquifer - San Antonio Area
Summary:(Excerpted from the report Summary)
This report presents the results of the Authority's Edwards Aquifer Data Collection Program for calendar year 2001.
Precipitation in the Edwards Aquifer region was generally above normal in 2001, especially in the spring and fall. Water levels generally exceeded average levels in the Authority's index wells in San Antonio, Hondo, and Uvalde.During the summer, there was sufficient rainfall to recharge the aquifer and reduce demand, which moderated the typical seasonal decline of water levels for that time of year. Consequently, the Authority did not institute water use restrictions during the summer of 2001.
Total recharge to the Edwards Aquifer was 1,069,400 acre-feet in 2001, approximately 50 percent above average.Discharge from the Edwards Aquifer through springs and wells totaled 897,200 acre-feet, which also exceeded average values.
The water samples were analyzed for major ions, metals, TDS, hardness, and nutrients. Concentrations of major constituents are relatively uniform throughout the freshwater parts of the Edwards Aquifer. The freshwater portion of the aquifer consistently yields very hard, calcium bicarbonate water with low TDS and few detectable metals. It is generally of such high quality that it usually only requires chlorination to meet public drinking water standards. Samples from two wells in the freshwater/saline water transect in San Marcos contained arsenic (LR-67-01-814A) and lead (LR-01-813A) concentrations above their MCLsLike groundwater from the freshwater areas, water from springs and streams also contain low concentrations of TDS and few detectable metals.
The water quality analyses also revealed organic chemicals in samples from two wells and two streams. Tetrachloroethene was detected at 7.6 μg/L in the sample from well YP-69-51-114 in Uvalde County. The source is an industrial dry cleaning operation that was destroyed by fire in 1979. Tetrachloroethene has been detected in this well and other wells in Uvalde since 1983, and the TNRCC has an agreed order with the responsible party for investigation and cleanup. Tetrachloroethene also was detected at 0.57 μg/L in the sample from well AY-68-29-414 in Bexar County. The Authority and TNRCC are investigating the source.
The herbicide, 2,4,5-T, was detected at 0.028 mg/L in the sample from the Hondo Creek at Tarpley on November 29, 2001. EPA banned this herbicide in 1970. Finally, pentachlorophenol was detected at 0.019 μg/L in the sample from Seco Creek at Miller Ranch collected on November 29, 2001. Pentachlorophenol is a wood preservative for utility poles, railroad ties, and other materials. Except for the tetrachloroethene detected in the Uvalde well, the concentrations of the organic compounds are below established levels for drinking water standards. The Authority will continue to monitor these locations to assess long-term data trends and investigate possible sources of the contaminants.
Nitrate concentrations ranged from less than 0.01 mg/L to 4 mg/L in samples from most wells and streams in the Edwards Aquifer region. The concentration in only one sample (TD-69-31-603) exceeded the MCL (10 mg/L); the Authority is studying the trends of nitrate concentrations for evidence of contamination sources in the aquifer.
The Authority continues its programs to protect the generally excellent water quality of the aquifer through investigating groundwater contamination and identifying and analyzing anomalous data from the Authority's aquifer-wide sampling program.
2011 Edwards Aquifer Hydrologic Data Fact Sheet for Recharge and Discharge
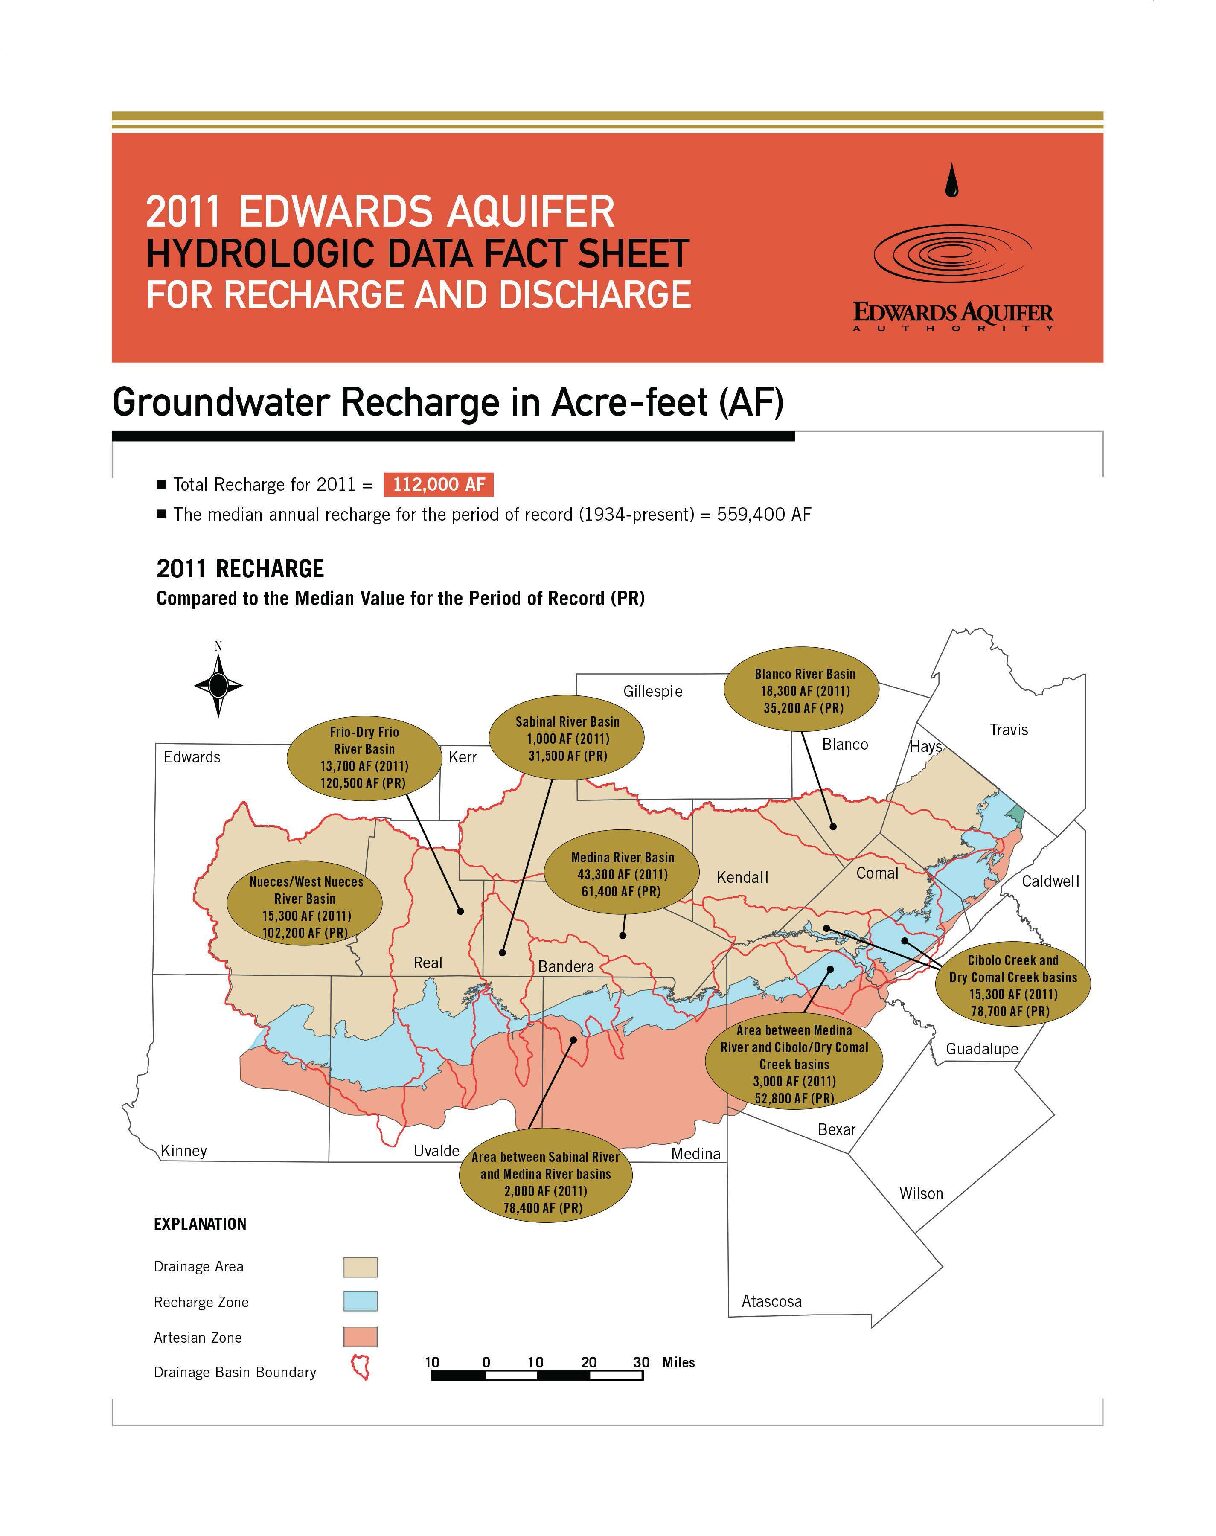
Description: 2011 Edwards Aquifer Hydrologic Data Fact Sheet for Recharge and Discharge
Location: Edwards Aquifer - San Antonio Area
Summary:Each year, the Edwards Aquifer Authority (Authority) publishes a comprehensive Hydrologic Data Report offering an extensive compilation of data on the Edwards Aquifer. This fact sheet is a sampling of the information that can be found in that report.
2010 Edwards Aquifer Hydrologic Data Fact Sheet for Recharge and Discharge
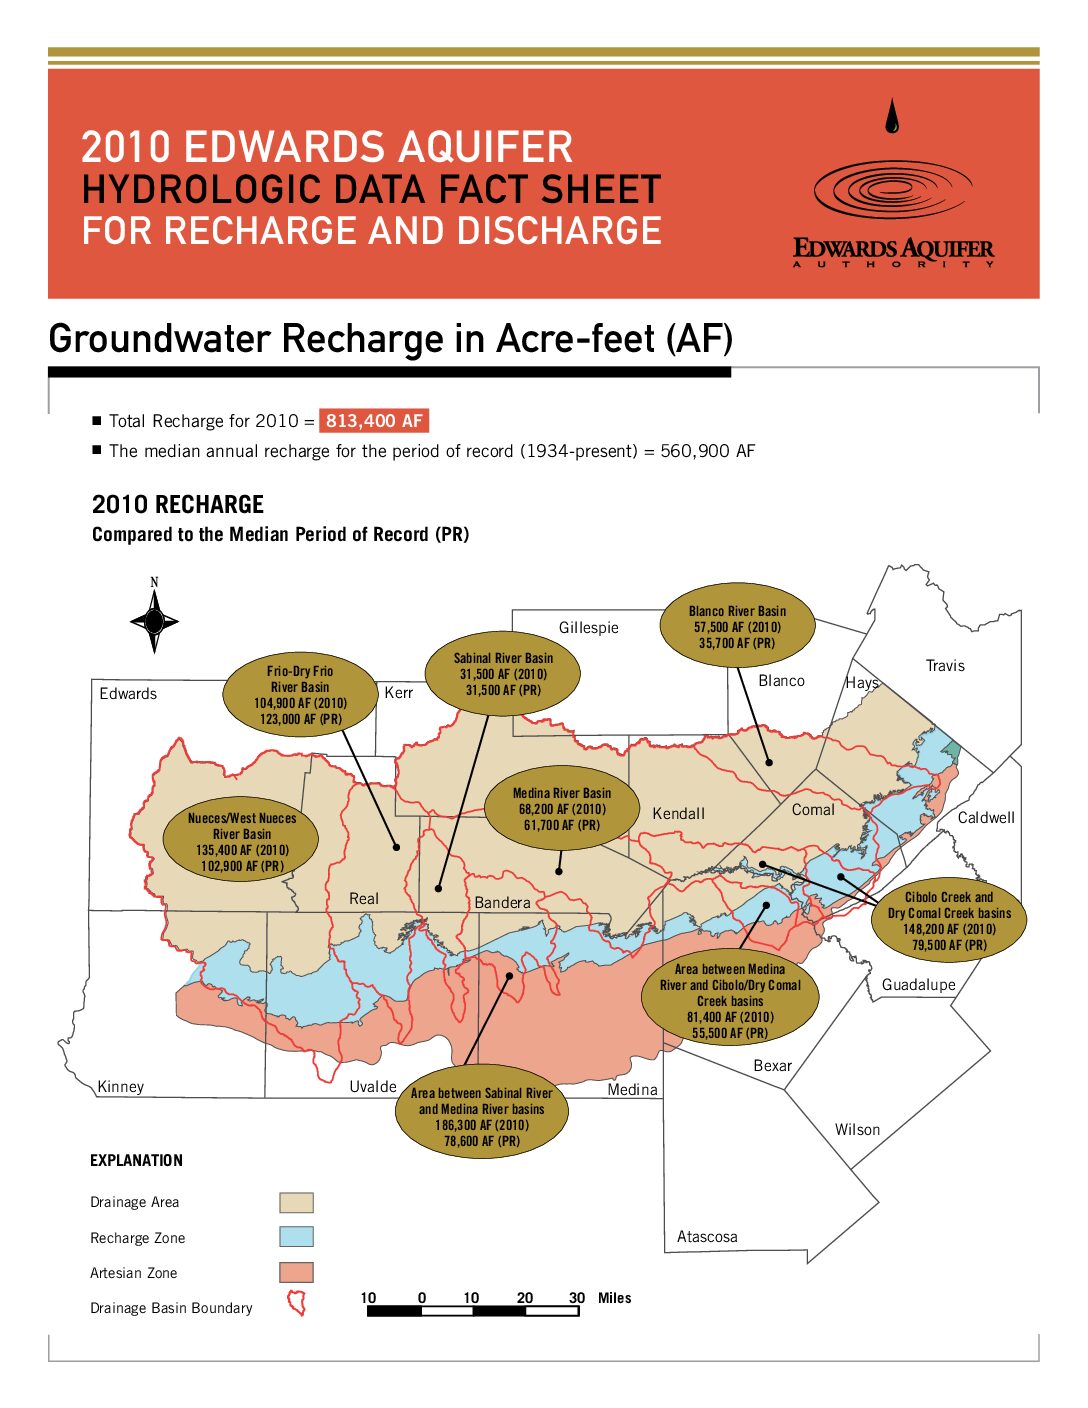
Description: Summary for 2010 on recharge and discharge in the Edwards Aquifer San Antonio Region
Location: Edwards Aquifer - Balcones Fault Zone - San Antonio Segment
Summary:Each year, the Edwards Aquifer Authority (Authority) publishes a comprehensive Hydrologic Data Report offering an extensive compilation of data on the Edwards Aquifer. This fact sheet is a sampling of the information that can be found in that report.
Edwards Aquifer Authority Hydrogeologic Data Report for 1999
Description: Annual report for 1999 on recharge, discharge, water levels and water quality in the Edwards Aquifer San Antonio Region. Note: Largeformat versions of the plates for this report are available at: https://www.edwardsaquifer.org/documents/2000_Esquil inetal_1999HydrologicDataPlates.pdf.
Report Number: 00-02
Location: Edwards Aquifer - San Antonio Area
Summary:In 1999, discharge from the Edwards Aquifer was greater than recharge as demonstrated by periods of decreasing water levels. The net decrease in water levels in the Bexar County index well was 22.6 feet for the year. The amount of rain received in the San Antonio region in 1999 was approximately 45% below normal.
The average estimated annual groundwater recharge to the Edwards Aquifer in the San Antonio region from 1934 through 1999 is approximately 680,000 acre-feet. Recharge in 1999 was approximately 473,400 acre-feet. The lowest annual recharge of 43,700 acre-feet occurred in 1956, and the highest annual recharge of 2,486,000 acre-feet occurred in 1992.
Estimated annual discharge from the Edwards Aquifer through wells and springs in 1999 was 898,800 acre-feet. The lowest annual discharge through wells and springs was 388,800 acre-feet, which occurred in 1955. Spring discharge from the Edwards Aquifer for 1999 was calculated at 456,100 acre-feet or 51 percent of the total discharge. Groundwater pumping accounted for 442,700 acre-feet of water discharged from the Edwards Aquifer in 1999. In general, water level data during 1999 reflected a decrease in water recharging the aquifer, although there was a decrease in pumping relative to 1998.
In 1999, the Authority collected water quality samples from 57 wells, two springs and eight stream basins. The water samples were analyzed for major ions, minor element metals, TDS, hardness and nutrients. Water samples from 12 wells, two springs and eight surface water locations were also analyzed for pesticides and herbicides. Water samples from eight wells and one spring were also analyzed for VOCs. None of the constituents analyzed were detected above published MCLs. No pesticides, herbicides, or VOC's were detected in the water samples analyzed for these compounds.


