Conditions
Science & Data Document Library
Science and Data Resources
Edwards Aquifer Authority Hydrologic Data Report for 2009
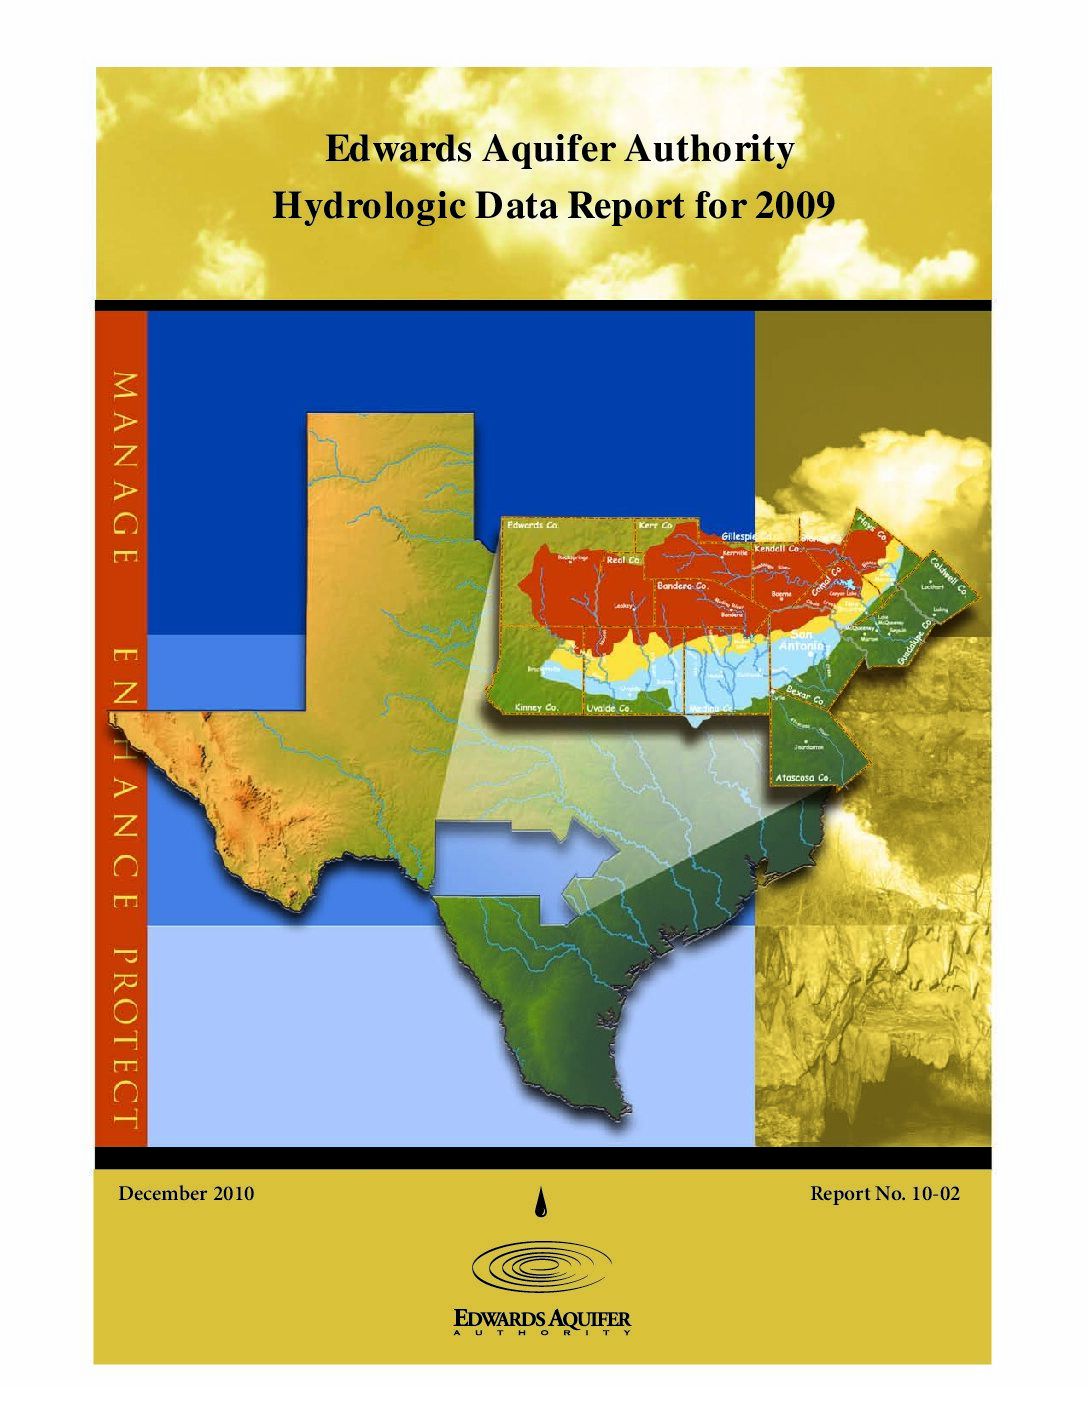
Description: Annual report for 2009 on recharge, discharge, water levels and water quality in the Edwards Aquifer San Antonio Region
Report Number: 2-Oct
Location: Edwards Aquifer - San Antonio Area
Summary:This report presents results of the Authority's Edwards Aquifer Data Collection Program for calendar year 2009.
Water levels at the Bexar County (J-17) index well trended downward from January through early September, when rains began and water levels began to rise. By late October, water levels at J-17 had risen to the historical average. Water levels remained above or close to the historical average for the remainder of the year. Other wells in the region exhibited similar behavior.
Precipitation in the Edwards Aquifer region was below the mean in 2009, with the exception of San Antonio, where the mean was exceeded by 0.38 inches. Although rainfall amounts improved in 2009 over calendar year 2008, regionally they were much lower in the west than in the east.Total estimated recharge to the Edwards Aquifer was significantly below median Calendar year 2009 recharge was lower than 2008 recharge by 2,000 acre-feet.In calendar year 2009, groundwater discharge from the Edwards Aquifer through wells and springs totaled 683,765 acre-feet. This amount is below the median total discharge of 766,600 acre-feet for the period of record (1934“2009).
For well-water samples collected in 2009, strontium was detected at one location in close proximity to the saline zone above the 15,000-μg/L PCL. Other metals detected include iron at two locations above the secondary standard and manganese at one location above the secondary standard. Surface and spring water sample analyses did not indicate the presence of any regulated metals above a regulatory limit.
Seven of 74 wells tested positive for fecal coliform, and ten of 74 wells sampled tested positive for fecal streptococcus.Of the 54 spring water samples, 24 were positive for fecal coliform, and 29 for fecal streptococcus.
In samples from wells, streams, and springs in the Edwards Aquifer region, nitrate-nitrite as nitrogen concentrations in 2009 ranged from below the laboratory reporting limit of 0.015 to 6.03 mg/L.The compounds chloroform, chloromethane, and toluene were detected below regulatory limits in wells in Medina, Bexar, and Hays counties. VOCs were not detected in the spring or in surface water samples collected for VOC analyses.No SVOCs were detected. The pesticide compound pentachlorophenol was detected at San Geronimo Creek at 0.25 μg/L.
Edwards Aquifer water is generally of such high quality that it normally requires only chlorination to meet public drinking-water standards. However, detection of nitrates and organic compounds in the aquifer is a concern, and the Authority will continue to monitor for these compounds to determine possible sources and trends.Confirmed detections of anthropogenic compounds such as pentachlorophenol at San Geronimo Creek and toluene, chloroform, and chloromethane in wells are a concern and warrant continued monitoring in the future. The Authority's aquifer-wide, water-quality sampling program will continue to monitor wells, streams, and springs for indications of water-quality impacts throughout the region. Focused investigations of areas with water quality impacts will be initiated as needed.
Statistical Analysis of Water-Level, Springflow and Streamflow Data for the Edwards Aquifer in South-Central Texas
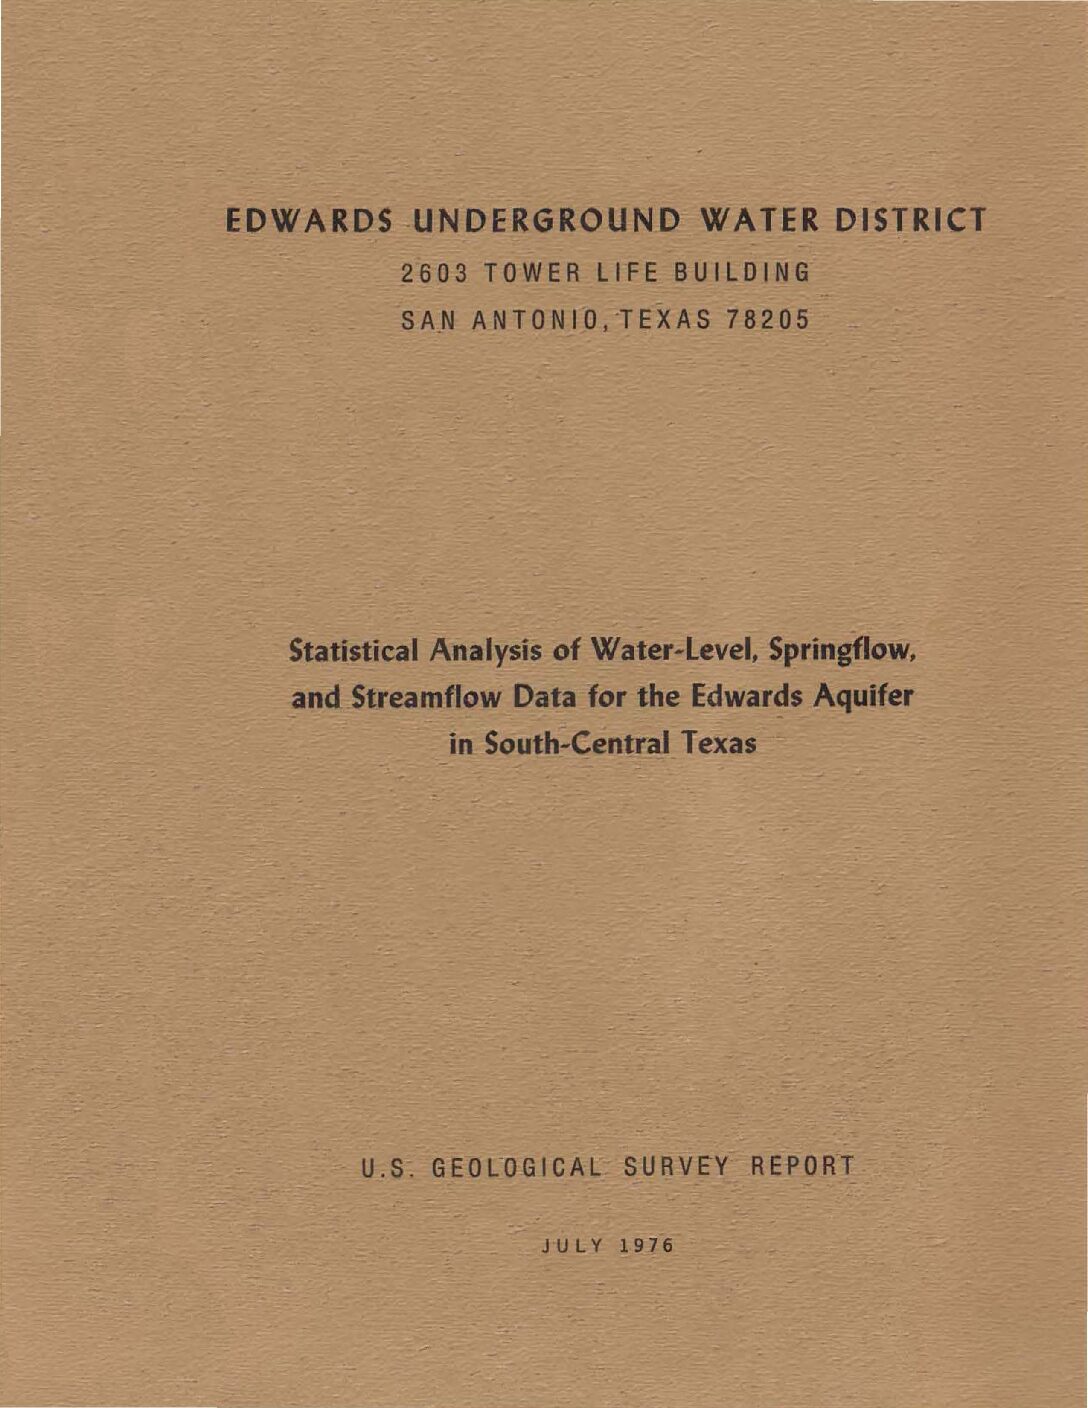
Description: Development of data-based simple and multiple linear regression equations for estimating water levels, springflow and streamflow in the San Antonio region of the Edwards Aquifer
Report Number: USGS 76-393
Location: Edwards Aquifer, Balcones Fault Zone, San Antonio Segment
Summary:Water-level, springflow, and streamflow data were used to develop simple and multiple linear-regression equations for use in estimating water levels in wells and the flow of three major springs in the Edwards aquifer in the eastern San Antonio area. The equations provide daily, monthly, and annual estimates that compare very favorably with observed data.
Analyses of geologic and hydrologic data indicate that the water discharged by the major springs is supplied primarily by regional underflow from the west and southwest and by local recharge in the infiltration area in northern Bexar, Comal, and Hays Counties.
Edwards Aquifer Ground-Water Divides Assessment, San Antonio Region, Texas
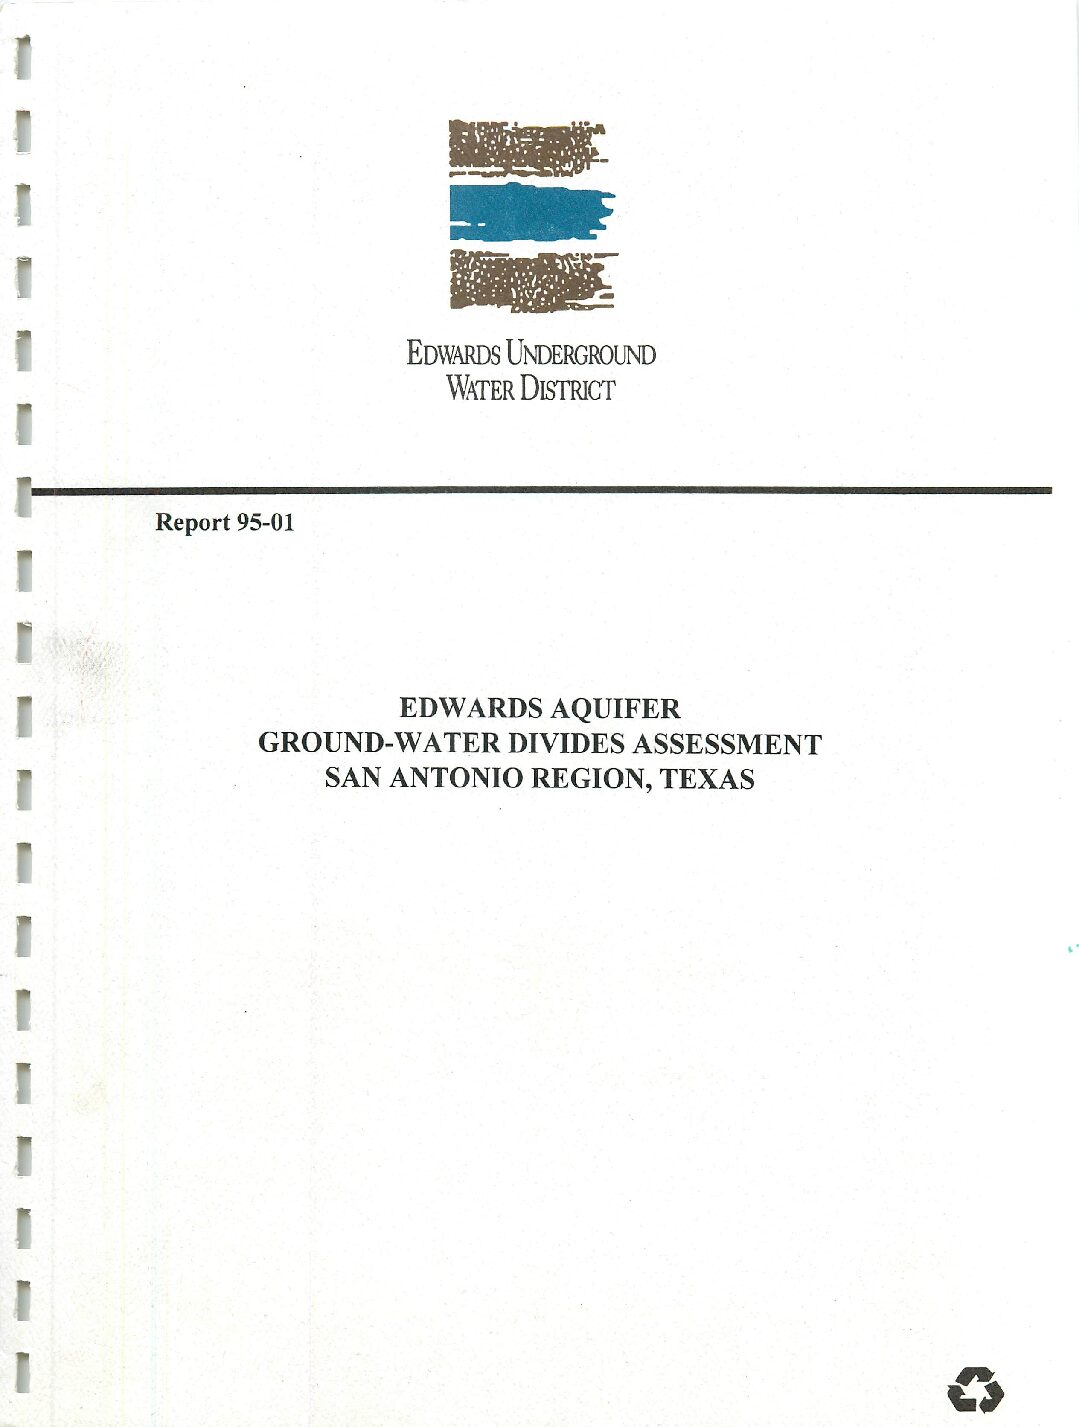
Description: Hydrogeologic study on location of groundwater divides in Hays and Kinney Counties
Report Number: 95-01
Location: Edwards Aquifer, Balcones Fault Zone, San Antonio Segment, Hays County, Kinney County
Summary:The Edwards aquifer in the San Antonio region extends approximately 180 miles from the ground-water divide in Kinney County on the western end to the ground-water divide in Hays County on the northeastern end. The exact delineation of the divides has not been clearly defined and has not been located in the same place through the history of hydrogeologic studies of the Edwards aquifer. The areas on the western and eastern ends of the Edwards aquifer in the San Antonio region were studied to evaluate and better delineate the ground-water divides, with the results discussed in this report.
In Hays County, a mound in the water table of the recharge zone results from recharge being focused in an area located along Onion Creek. This area has extensive exposures of Kirschberg evaporite member and numerous faults, which are favorable for the development of secondary porosity and permeability. In the artesian pan of the aquifer, the water-level high may be associated with a preferred flowpath that is directed from the Onion Creek recharge area into the artesian pan of the aquifer, possibly being modified by an unknown subsurface geologic structure. The water-level high in the artesian pan of the aquifer is formed in part by the effects of pumpage in the vicinities of the Cities of Kyle and Buda located on either side of the high and the relative lack of pumping in the area between the two cities. Water levels measured toward the end of summer 1994 in the artesian pan of the aquifer appear to be below the level of San Marcos Springs Lake. This suggests that, during times of lower water levels, the artesian part of the aquifer in this area may not supply water to San Marcos Springs but instead to pumpage near Kyle and Buda and to Barton Springs. A water-level high between Kyle and Buda that is shown by the summer 1994 measurements indicates that flow during this period does not move past San Marcos Springs to Banon Springs. Based on the data from this report, the groundwater divide in Hays County should be located generally between the Cities of Buda and Kyle in the artesian part of the aquifer and along Onion Creek in the Edwards aquifer recharge zone.
In Kinney County, several anticline and syncline folds that plunge to the southwest channel water like a large sheet of corrugated tin toward Las Moras and Pinto Springs. Intrusions of essentially impermeable igneous rocks that generally occur along the axes of the anticlines, which are folded upward, help to magnify the constraining effect of the folds. The intrusions act as a grout curtain where the igneous material has been intruded into the Edwards limestone. Water levels have shown some minor changes through time, but no effects from the filling of Lake Amistad have been detected in the vicinity of the ground-water divide in Kinney County. Two noses appear on the water-level contour maps for Kinney County, both reflective of the underlying anticlines and synclines. However, water-level measurements indicate that a component of flow comes past Las Moras Springs from west to east toward the City of Uvalde.
As a result, the divide should be placed to the west of Las Moras Springs. It probably runs to the north toward Pinto Mountain and then along a topographic high in the unnamed escarpment north of Pinto Mountain. Because stream losses in the West Nueces River are presently used for recharge calculations for the San Antonio region of the Edwards aquifer and water-level contours indicate that a portion of this recharge is moving toward Pinto and Las Moras Springs, discharge of both these springs should be considered as part of any water-balance calculations for the Edwards aquifer in this area.
Report on the Edwards Aquifer San Antonio Region, Texas
Description: Review of geology, hydrogeology, recharge and pumpage of the Edwards Aquifer, Balcones Fault Zone, San Antonio Segment Note: This report is included for its historical value and may have been replaced by more recent studies.
Location: Edwards Aquifer, Balcones Fault Zone, San Antonio Segment
Summary:Review of geology, hydrogeology, recharge and pumpage of the Edwards Aquifer, Balcones Fault Zone, San Antonio Segment.
Description, Formation, Recharge Zone, Artesian Zone, Groundwater Storage, Groundwater Movement, Historical Discharge, Historical Pumpage Spring Flows, Underground River?, Water Quality Issues, Effects of Selected Pumpage on Spring Flow, Revised Emergency Withdrawal Reduction Plan, Bibliography
Records of Wells and Springs, San Antonio Area, Texas
Description: Records of wells and springs in the Edwards Aquifer, Balcones Fault Zone, San Antonio Segment, 1956-1968
Report Number: Bulletin 24
Location: Edwards Aquifer, Balcones Fault Zone, San Antonio Segment
Summary:The purpose of this report is to up-date the published records of wells and springs in the San Antonio area, including all major well developments during the period 1956-68. Previous compilations are contained in the following reports: Petitt and George {1956); Bennett and Sayre {1962); Welder and Reeves {1962); Holt (1959); George (1952); and DeCook (1955) .
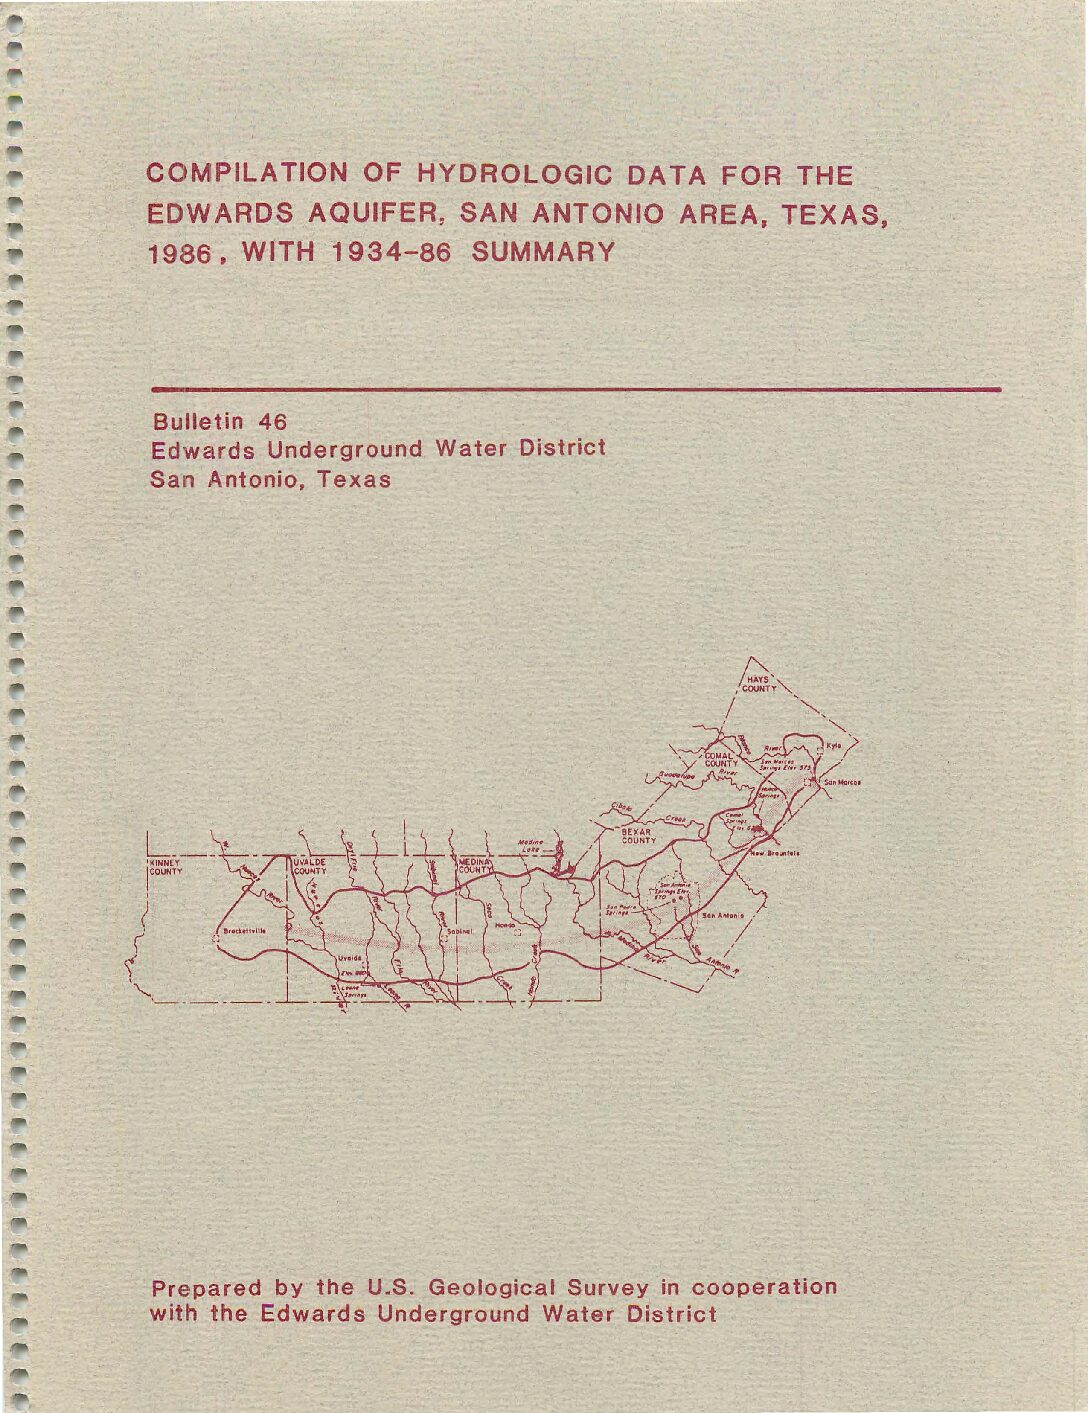
The San Antonio area as used in this report is the same area as defined by Garza (1962). It extends from Brackettville to Kyle, varies from 5 to 4o miles wide, and includes all or parts of Bexar, Comal, Hays, Kinney, Medina, and Uvalde Counties (figs. 1-6).
The wells listed in this report are mainly those with large yields that provide water for municipal supply, industrial use, or irrigation. Some smaller yield wells and springs that are being observed in hydrologic studies are included. Most of the wells produce water from the Edwards and associated limestones. A few wells are included that produce from the Glen Rose Limestone, the Carrizo Sand, or other formations.
Edwards Aquifer Hydrogeologic Report for 1997-Plates
Edwards Aquifer Hydrogeologic Report for 1995
Description: Annual report for 1995 on recharge, discharge, water levels and water quality in the Edwards Aquifer San Antonio Region
Report Number: 96-04
Location: Edwards Aquifer - San Antonio Area
Summary:The average estimated annual groundwater recharge to the Edwards aquifer in the San Antonio area from 1934 through 1995 was 674,200 acre-feet. Recharge in 1995 was 531,300 acre-feet, which was well below the regional average. The lowest annual recharge of 43,700 acre-feet occurred in 1956 and the highest annual recharge of 2,486,000 acre-feet occurred in 1992.
The estimated annual discharge from the Edwards aquifer through wells and springs in 1995 was 761,000 acre-feet. The lowest annual discharge through wells and springs was 388,800 acre-feet which occurred in 1955. Water level data for wells during 1995 reflected a general decrease in Edwards aquifer groundwater in storage during the year.
In 1995, the Edwards Aquifer Authority collected water quality samples from 58 wells, three springs, and seven streams and rivers. These samples were analyzed for 74 constituents and parameters which included common organic constituents, nutrients, dissolved organic carbon, metals and VOCs. Laboratory analyses indicated that samples from 33 wells contained detectable metal concentrations. These concentrations were well below the MCLs for those
constituents. No detectable concentrations of pesticides or VOCs were measured in the wells sampled in 1995.
Results of the Authority's 1995 water quality monitoring program illustrate the continued excellent quality of water in the Edwards aquifer.
Edwards Aquifer Hydrogeologic Status Report for 1992
Description: Annual report for 1992 on recharge, discharge, water levels and water quality in the Edwards Aquifer San Antonio Region
Report Number: 93-05
Location: Edwards Aquifer - San Antonio Area
Summary:Surface-water data for the San Antonio area used to calculate annual recharge and discharge of the Edwards aquifer, consist of flow data for streams and discharge data for springs, and quantity data for reservoirs. The data is stored in the National Water Information system, a computerized data base operated by the U. S. Geological Survey.
The average estimated annual groundwater recharge to the Edwards aquifer in the San Antonio area, Texas, from 1934 through 1992 was 682,860 acre-feet. Recharge in 1992 was 2,486,000 acre-feet, which is the largest estimated annual recharge. The lowest annual recharge of 43,700 acre-feet occurred in 1956.
The estimated annual discharge from the Edwards aquifer by wells and springs in 1992 was 1,130,000 acre-feet, which is the largest calculated annual discharge for the period of record which began in 1934. The lowest annual discharge by wells and springs for the same time period was 388,800 acre-feet in 1955.
Water level data for wells during 1992 reflected above average to record volume of groundwater in storage in the Edwards aquifer during most of the year.
Water samples from 61 wells and 3 springs in the Edwards aquifer were analyzed for more than 90 properties or constituents, most of which affect the suitability of the water for domestic use. Concentrations of constituents in water from one well completed in the freshwater zone exceeded the maximum contaminant level for fluoride established for public water systems.
Trace concentrations of volatile organic compounds were detected in samples from three wells. Results of the 1992 water sampling and analysis program illustrate the continued excellent quality of water in the Edwards aquifer.
1991 Hydrologic Data Report Compilation of Hydrologic Data for the Edwards Aquifer, San Antonio Area, Texas, 1991, with 1934-91 Summary
Description: Annual report for 1991 on recharge, discharge, water levels and water quality in the Edwards Aquifer San Antonio Region
Report Number: Bulletin 51
Location: Edwards Aquifer - San Antonio Area
Summary:The average estimated annual ground-water recharge to the Edwards aquifer in the San Antonio area, Texas, from 1934 through 1991 was 651,700 acre-feet. Recharge in 1991 was 1,508,400 acre-feet, which is the third largest estimated annual recharge since 1934. The maximum annual recharge of 2,003,600 acre-feet occurred in 1987, and a minimum annual recharge of 43,700 acre-feet occurred in 1956.
The estimated annual discharge from the Edwards aquifer by wells and springs in 1991 was 790,300 acre-feet, which is the fourteenth largest calculated annual discharge since 1934. Annual discharge by wells and springs ranged from a maximum of 960,900 acre-feet in 1977 to a minimum of 388,800 acre-feet in 1955.
Water-level data for wells during 1991 reflected a less-than- to about average volume of ground water in storage in the aquifer during most of the year.
Water samples from 61 wells (including wells drilled in 1985 that transect the freshwater/saline-water interface) and 3 springs in the Edwards aquifer were analyzed for more than 90 properties or constituents, most of which affect the suitability of the water for domestic use. Concentrations of constituents in water from three wells completed in the freshwater zone exceeded the maximum contaminant levels established for public water systems. Trace concentrations of volatile organic compounds were detected in samples from seven wells.
Surface-water data for the San Antonio area, which were used to calculate annual recharge to and annual discharge from the Edwards aquifer, consisted of discharge data for streams and springs and contents data for reservoirs. The data are stored in the National Water Information System, a computerized data base operated by the U.S. Geological Survey.
1990 Hydrologic Data Report Compilation of Hydrologic Data for the Edwards Aquifer, San Antonio Area, Texas, 1990, with 1934-90 Summary
Description: Annual report for 1990 on recharge, discharge, water levels and water quality in the Edwards Aquifer San Antonio Region
Report Number: Bulletin 50
Location: Edwards Aquifer - San Antonio Area
Summary:The average estimated annual ground-water recharge to the Edwards aquifer in the San Antonio area, Texas, from 1934 through 1990 was 636,700 acre-feet. Recharge in 1990 was 1,123,200 acre-feet, which is the eighth largest estimated annual recharge since 1934. The maximum annual recharge of 2,003,600 acre-feet occurred in 1987, and a minimum annual recharge of 43,700 acre-feet occurred in 1956.
The estimated annual discharge from the Edwards aquifer by wells and springs in 1990 was 730,000 acre-feet, which is the seventeenth largest calculated annual discharge since 1934. Annual discharge by wells and springs ranged from a maximum of 960,900 acre-feet in 1977 to a minimum of 388,800 acre-feet in 1955.
Water levels in many of the wells during 1990 fluctuated near the midpoint between record high and low levels, reflecting a greater-than- to about average volume of ground water in storage in the aquifer during most of the year. In 1990, water levels rose during the early winter and early spring, after which water levels generally remained about average in most of the area.
Water samples from 87 wells (including wells drilled in 1985 that transect the freshwater/saline-water interface) and 3 springs in the Edwards aquifer were analyzed for more than 90 properties or constituents, most of which affect the suitability of the water for domestic use. Concentrations of constituents in water from the freshwater zone did not exceed the maximum contaminant levels established for public water systems. Trace concentrations of volatile organic compounds, however, were detected in samples from 14 wells.
Surface-water data for the San Antonio area, which were used to calculate annual recharge to and annual discharge from the Edwards aquifer, consisted of discharge data for streams and springs and contents-data for reservoirs. These data are stored in the National Water Information System, a computerized data base operated by the U.S. Geological Survey.
1989 Hydrologic Data Report Compilation of Hydrologic Data for the Edwards Aquifer, San Antonio Area, Texas, 1989, with 1934-89 Summary
Description: Annual report for 1989 on recharge, discharge, water levels and water quality in the Edwards Aquifer San Antonio Region
Report Number: Bulletin 49
Location: Edwards Aquifer - San Antonio Area
Summary:The average estimated annual ground-water recharge to the Edwards aquifer in the San Antonio area, Texas, from 1934 through 1989 was 628,000 acre-feet. Recharge in 1989 was 214,400 acre-feet, which is the tenth smallest estimated annual recharge since 1934. The maximum annual recharge of 2,003,600 acre-feet occurred in 1987, and a minimum annual recharge of 43,700 acre-feet occurred in 1956.
The calculated annual discharge from the Edwards aquifer by wells and springs in 1989 was 766,500 acre-feet, which is the fifteenth largest calculated annual discharge since 1934. Annual discharge by wells and springs ranged from a maximum of 960,900 acre-feet in 1977 to a minimum of 388,800 acre-feet in 1955.
Water levels in many of the wells during 1989 fluctuated near the midpoint between record high and low levels, reflecting a near average volume of ground water in storage in the aquifer during most of the year. In 1989, substantial increases occurred during the late winter and early spring, after which water levels remained near average in most of the area.
Water samples from 71 wells and 3 springs in the Edwards aquifer were analyzed for more than 50 properties or constituents, most of which affect the suitability of the water for domestic use. Concentrations of constituents in water from the freshwater zone did not exceed the maximum contaminant levels established for public water systems. However, trace concentrations of organic compounds were detected at five wells. In 1989, samples were collected and analyzed from wells transecting the freshwater/saline-water interface.
The Edwards Aquifer Extremely Productive, But
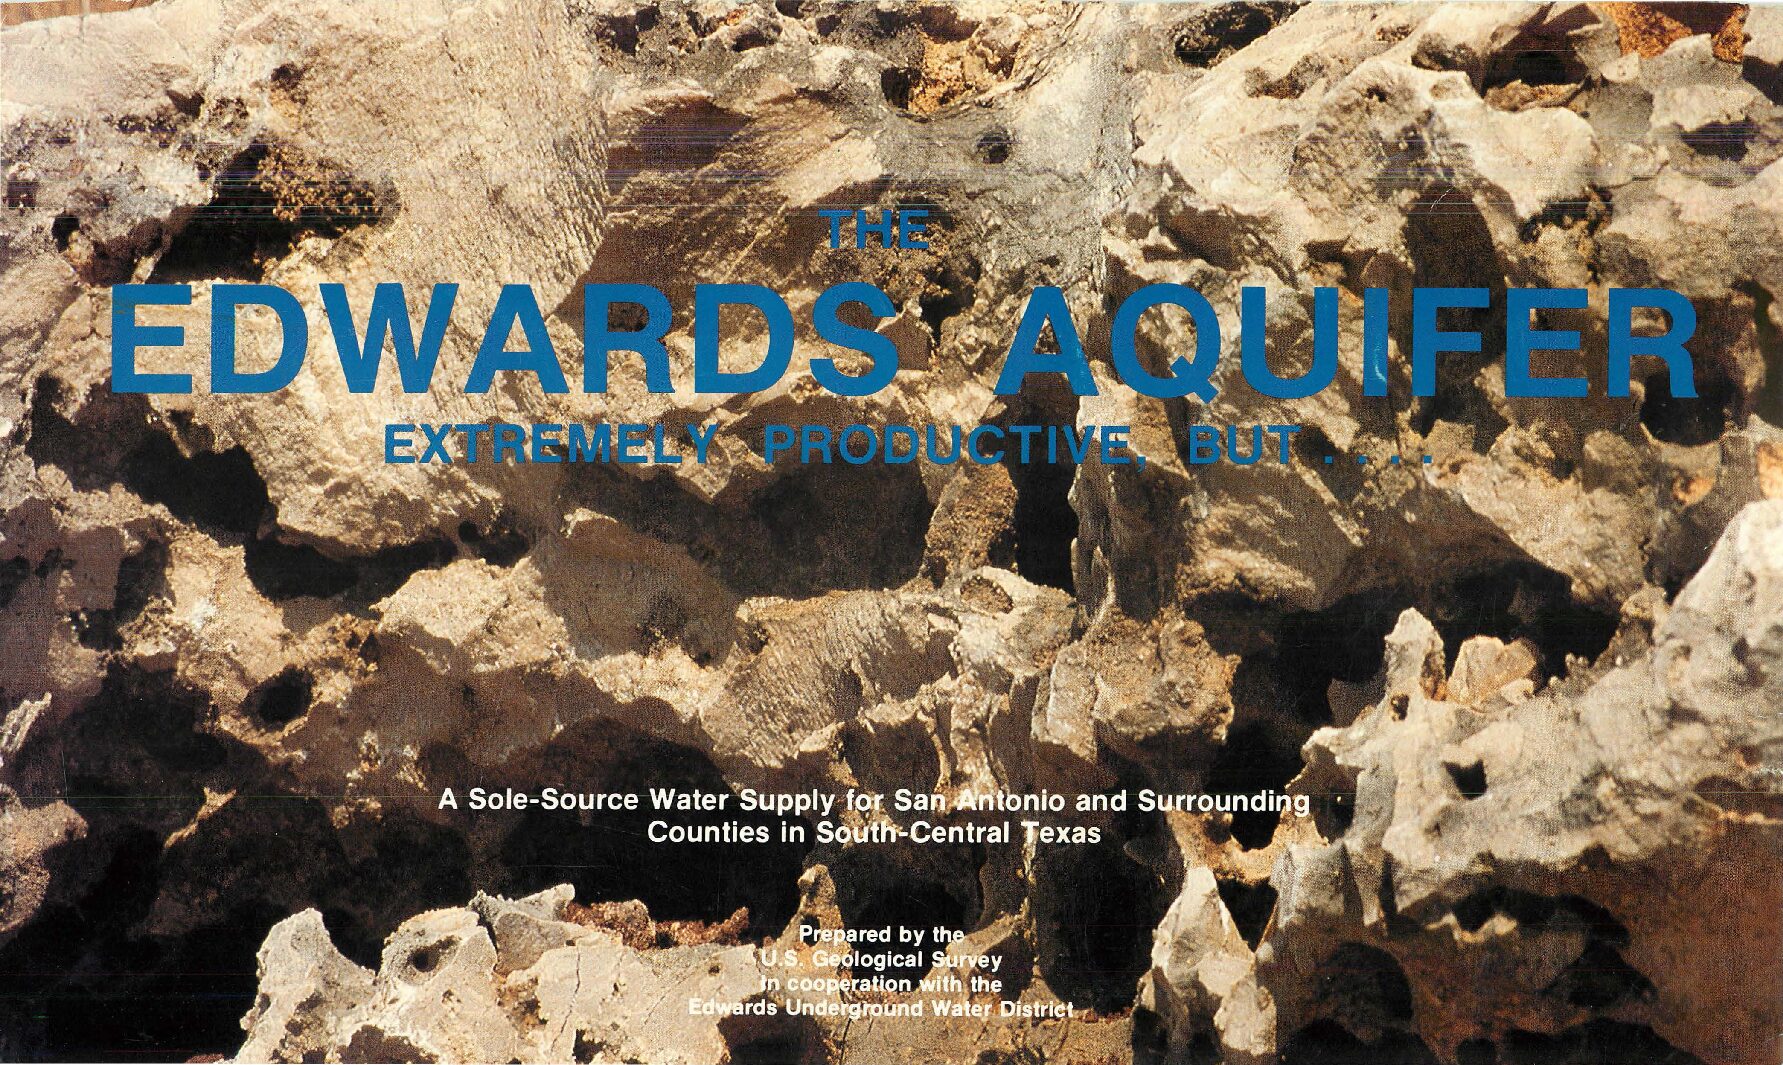
Description: Semi-technical description of the Edwards aquifer and considerations for its use and preservation for the general public and policy-makers
Location: Edwards Aquifer - General
Summary:Note: This report is included for its historical value and may not reflect current scientific understanding of the Edwards Aquifer.
This reportis a compilation of technical information presented in a manner to be useful to the lay reader and particularly for the decision-makers of the region. It is intended to bridge the gap between the basic information contained in a textbook, Water, Water Conservation and the Edwards Aquifer and the numerous technical reports of the District and others.
The need for protection of the Edwards Aquifer water quality and the growth of this region with the resultant increasing demand for the water resource, requires a greaterunderstanding of the Edwards Aquifer by all and how it should be protected and managed. The publication of this report will further the general understanding of the Edwards Aquifer and assist everyone in their efforts to reach decisions on the future of our water resource.
Continued economic development in south-central Texas will depend upon the available water supply. The principal source of water for San Antonio and the surrounding area will continue to be the Edwards aquifer, although supplemental supplies will need to be developed. Intelligent management decisions concerning how, when, and where to develop the additional water supplies can be made only if pertinent data concerning the total water resource are available to the decision makers. Information needed by elected officials and professional water managers include: Rainfall-runoff data on surface streams, maximum potential recharge to the aquifer, storage capacity of the aquifer, movement of water through the aquifer, and safe withdrawal rates.
It is readily recognized that the future supply of water provided by the Edwards aquifer will have a significant effect on continued economic development in south-central Texas. Most decision makers agree that alternative
water development will be needed to accommodate increased economic development. However, there may be disagreement on the most reliable and cost-effective means of developing alternative water supplies. Supplementing ground-water supplies by constructing surface water reservoirs and increasing the ground-water supply by enhancing recharge are being considered. Conservation measures have been introduced throughout the area and discussion has begun on considering a water reuse program. The decision makers“the elected public officials and the professional water managers-need information concerning the hydrology of the Edwards aquifer to select the most suitable plan of water development. The first of many critical decisions is to determine if existing hydrologic information, knowledge, or data are adequate for selection of a proper water development plan. Subsequent decisions regarding the implementation of plans for supplemental water development also will require detailed information about the aquifer.
Information needs include data for determination of the maximum recharge potential and the maximum quantity of water that can be safely withdrawn from the aquifer during periods of various climatic conditions without endangering the quality of the resource and without causing severe hardship for the many various water users. Investigations of the Edwards aquifer are necessary to obtain these data. To make timely and critical decisions, the planners and water managers need to have knowledge and understanding of many specific and related technical hydrological considerations such as: Quantity of precipitation and its distribution in time and space, an understanding of the recharge mechanism, how water is contained in and moves through the aquifer, the quality of water in the aquifer and the potential for contamination, and the effects of temporary partial depletion of water in storage during droughts.
The report has been prepared to enhance the public’s general understanding of the Edwards aquifer, and to aid officials in making decisions about the aquifer. The report also is intended to identify limitations in the understanding and knowledge of the aquifer, thereby facilitating the planning of investigative programs. This report is not intended to provide solutions to currently prevailing unanswered questions.
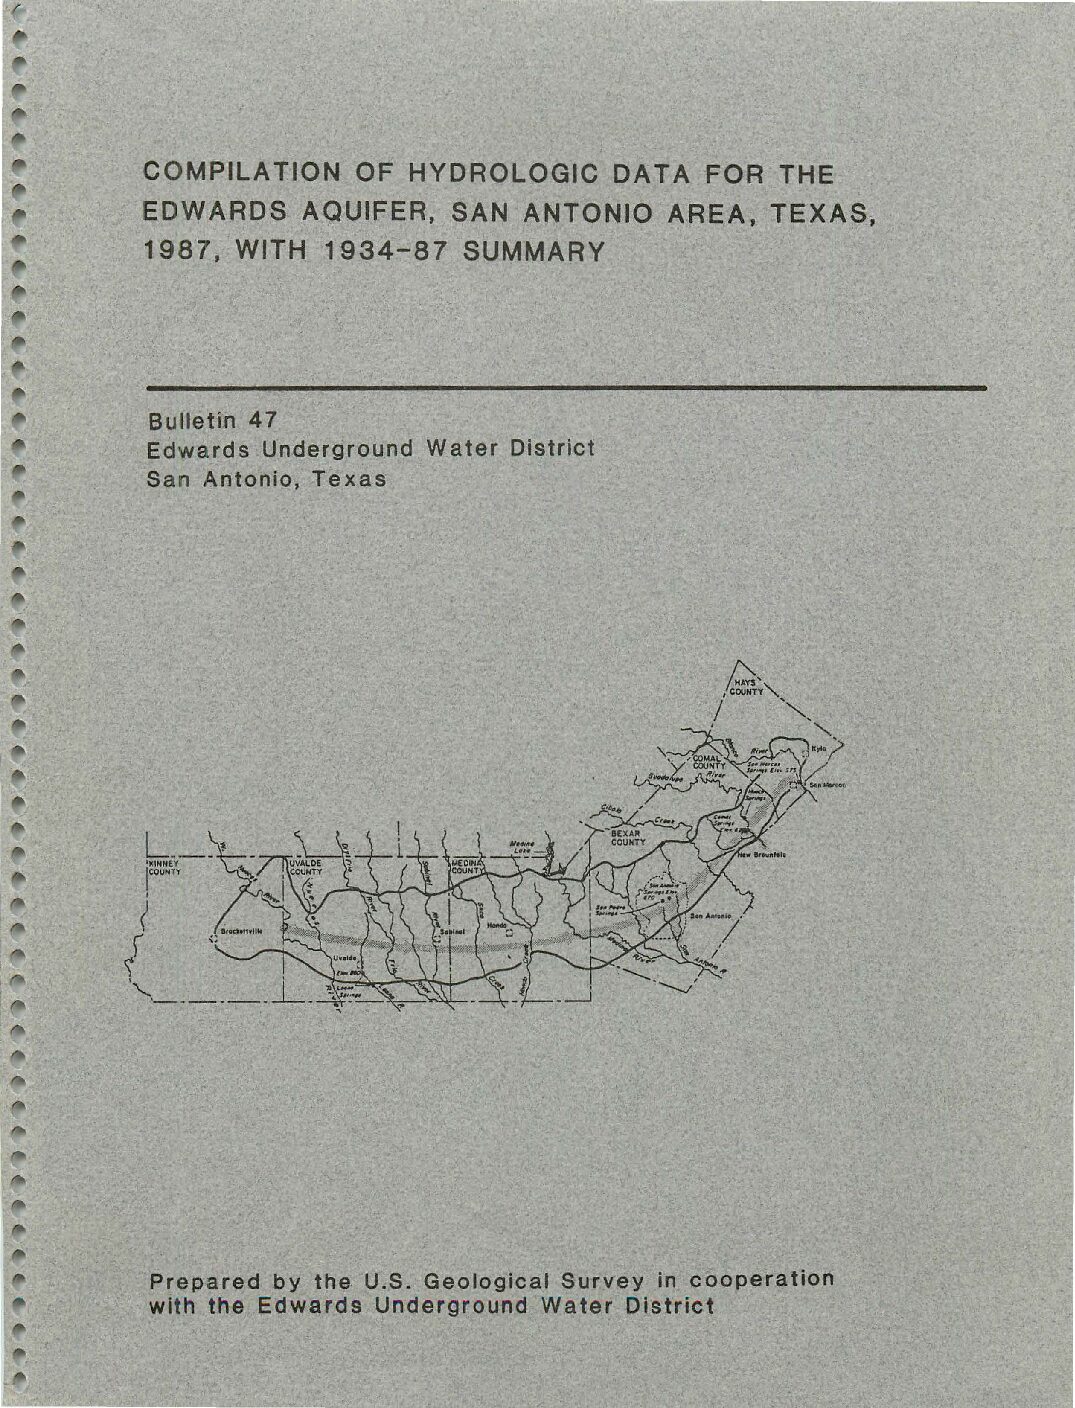
1987 Hydrologic Data Report Compilation of Hydrologic Data for the Edwards Aquifer, San Antonio Area, Texas, 1987, with 1934-87 Summary
Description: Annual report for 1987 on recharge, discharge, water levels and water quality in the Edwards Aquifer San Antonio Region. Note: Large-format versions of the plates for this report are available Here
Report Number: Bulletin 47
Location: Edwards Aquifer - San Antonio Area
Summary:The average estimated annual ground-water recharge to the Edwards aquifer in the San Antonio area, Texas, from 1934 through 1987 was 640,600 acre-feet. Recharge in 1987 was 2,003,600 acre-feet, which is the highest estimated annual recharge since 1934. The previous maximum annual recharge of 1,711,200 acre-feet occurred in 1958, and a minimum annual recharge of 43,700 acre-feet occurred in 1956.
The calculated annual discharge from the Edwards aquifer by wells and springs in 1987 was 940,400 acre-feet, which is the second highest calculated annual discharge since 1934. Annual discharge by wells and springs ranged from a maximum of 960,900 acre-feet in 1977 to a minimum of 388,800 acre-feet in 1955.
Water levels in many of the wells during 1987 fluctuated above the midpoint between record high and low levels, indicating an above average volume of ground water in storage in the aquifer during most of the year. In 1987, substantial increases in storage occurred during the late spring and early summer, after which water levels remained above average in most of the area.
Analyses of water samples from 83 wells and 3 springs in the Edwards aquifer show that the water quality in the freshwater zone is significantly better than the level established for public water systems. However, trace concentrations of organic compounds were detected in many of the analyses. Analyses of water samples collected from 10 wells in Uvalde County showed concentrations of tetrachloroethylene in excess of 5 micrograms per liter. In 1987, samples were collected and analyzed from wells along the badwater line and did not detect changes in water quality as the potentiometric head in the Edwards aquifer changed.
Note: Large-format versions of the plates for this report are available at:https://www.edwardsaquifer.org/wp-content/uploads/2019/05/1988_NalleyRettman_1987HydrologicData.pdf
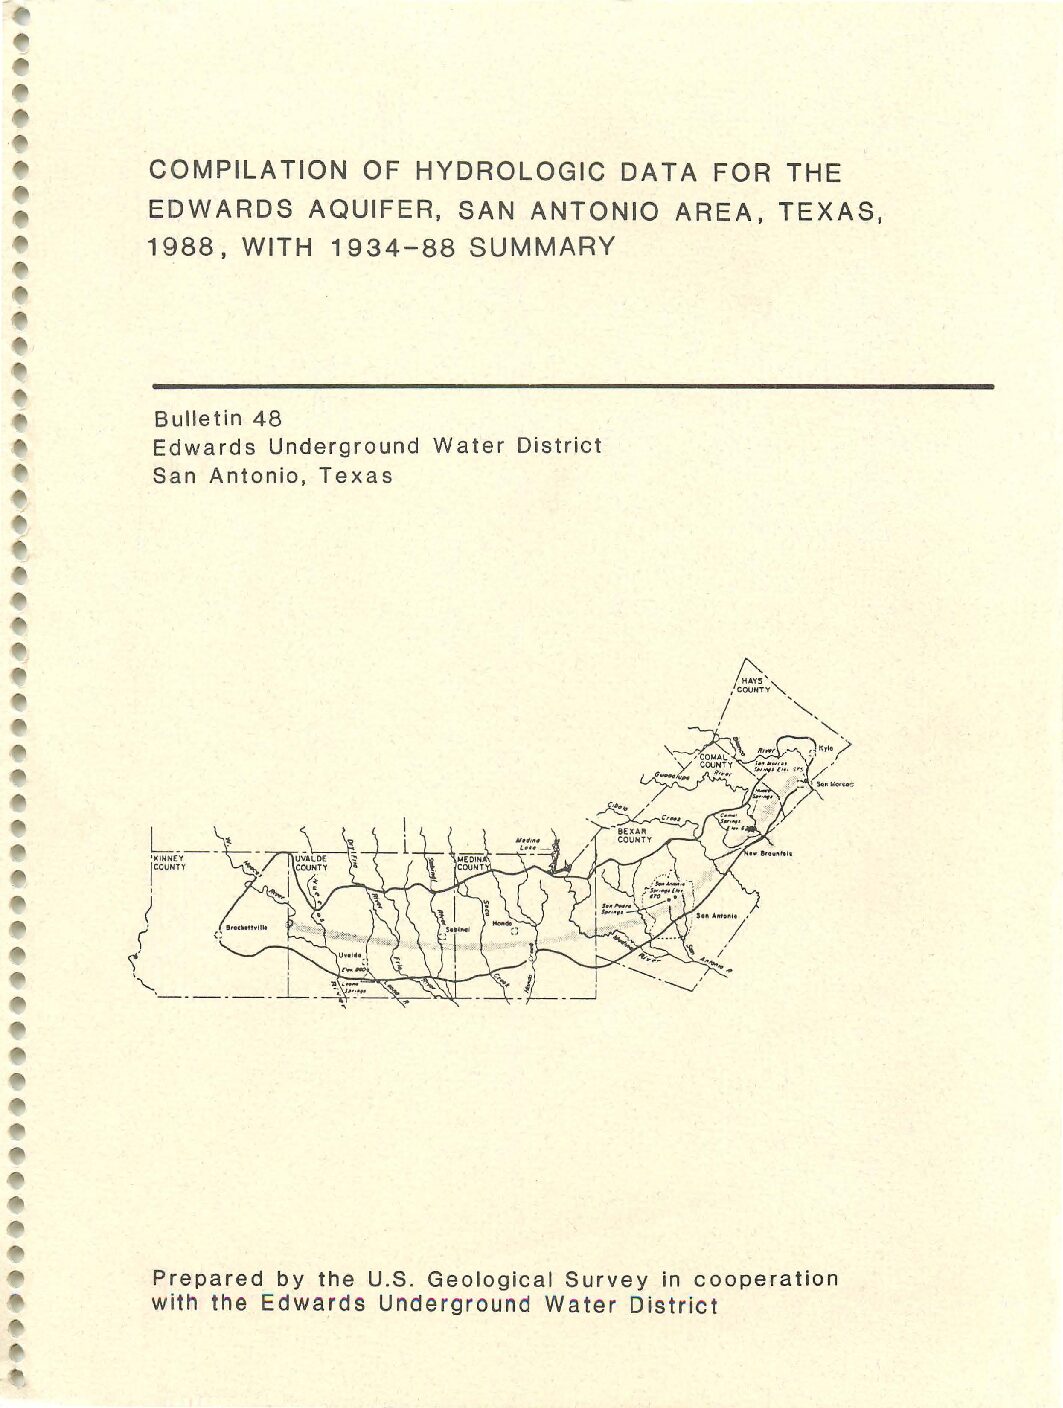
1988 Hydrologic Data Report Compilation of Hydrologic Data for the Edwards Aquifer, San Antonio Area, Texas, 1988, with 1934-88 Summary
Description: Annual report for 1988 on recharge, discharge, water levels and water quality in the Edwards Aquifer San Antonio Region. Note: Large-format versions of the plates for this report are available at: https://www.edwardsaquifer.org/wp-content/uploads/2019/05/1989_Nalley_1988HydrologicData.pdf.
Report Number: Bulletin 48
Location: Edwards Aquifer - San Antonio Area
Summary:The average estimated annual ground-water recharge to the Edwards aquifer in the San Antonio area, Texas, from 1934 through 1988 was 635,500 acre-feet. Recharge in 1988 was 355,500 acre-feet, which is the fifteenth smallest estimated annual recharge since 1934. The maximum annual recharge of 2,003,600 acre-feet occurred in 1987, and a minimum annual recharge of 43,700 acre-feet occurred in 1956.
The calculated annual discharge from the Edwards aquifer by wells and springs in 1988 was 926,400 acre-feet, which is the third largest calculated annual discharge since 1934. Annual discharge by wells and springs ranged from a maximum of 960,900 acre-feet in 1977 to a minimum of 388,800 acre-feet in 1955.
Water levels in many of the wells during 1988 fluctuated above to near the mid-point between record high and low levels, reflecting an above to near average volume of ground water in storage in the aquifer during most of the year. In 1987, substantial increases occurred during the late spring and early summer, after which water levels remained above average in most of the area. Water levels then remained above to near average throughout 1988. Analyses of water samples from 56 wells and 3 springs in the Edwards aquifer show that the water quality in the freshwater zone is significantly better than the level established for public water systems. However, trace concentrations of organic compounds were detected in many of the analyses. In 1988. samples were collected and analyzed from wells transecting the badwater line and no significant changes in water quality were detected as the potentiometric head in the Edwards aquifer changed.
Note: Large-format versions of the plates for this report are available at: https://www.edwardsaquifer.org/wp-content/uploads/2019/05/1989_Nalley_1988HydrologicData.pdf
1987 Hydrologic Data Report Compilation of Hydrologic Data for the Edwards Aquifer, San Antonio Area, Texas, 1987, with 1934-87 Summary