 Conditions
Science & Data Document Library
Science and Data Resources
Survey Report on Edwards Underground Reservoir Guadalupe, San Antonio and Nueces Rivers and Tributaries, Texas. Volume 3 Appendix III Geology Appendix V Economic Base Study Appendix VI Recreation and Wildlife
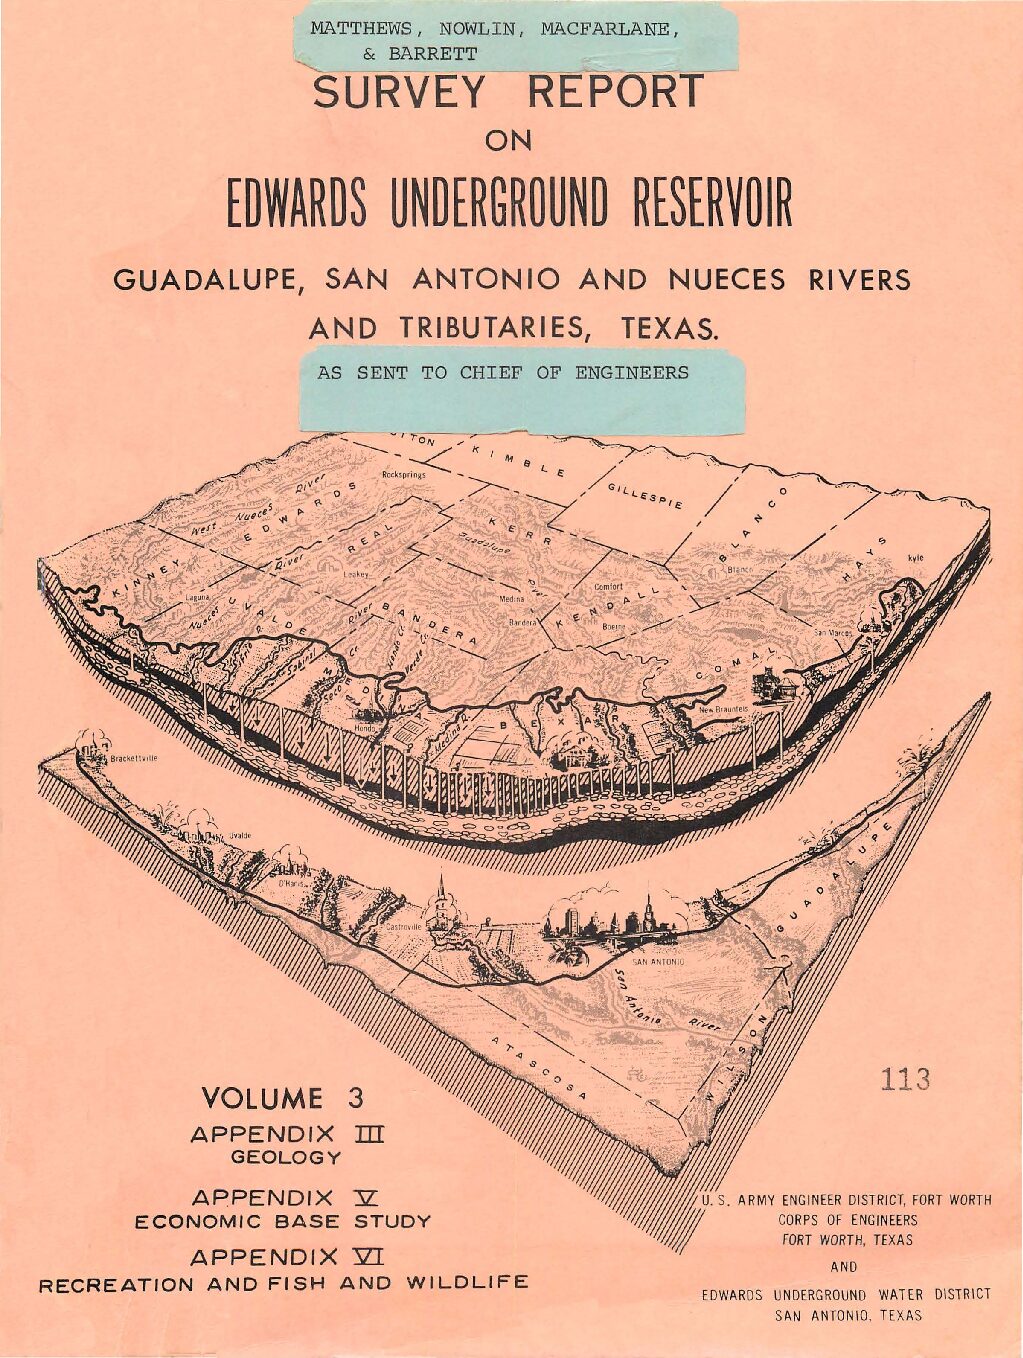
Description: Note: This report is included for its historical value and may have been replaced by more recent studies. Volume 3 (Appendix III Geology Appendix V Economic Base Study Appendix VI Recreation and Wildlife) of survey by the US Army Corps of Engineers and the Edwards Underground Water District, emphasizing possible locations for reservoirs and containment systems.
Location: Edwards Aquifer, Guadalupe River, San Antonio River, Nueces River
Summary:Note: This report is included for its historical value and may have been replaced by more recent studies. Volume 3 (Appendix III Geology Appendix V Economic Base Study Appendix VI Recreation and Wildlife) of survey by the US Army Corps of Engineers and the Edwards Underground Water District, emphasizing possible locations for reservoirs and containment systems.
Final Report for Deep Aquifer Biota Study of the Edwards Aquifer
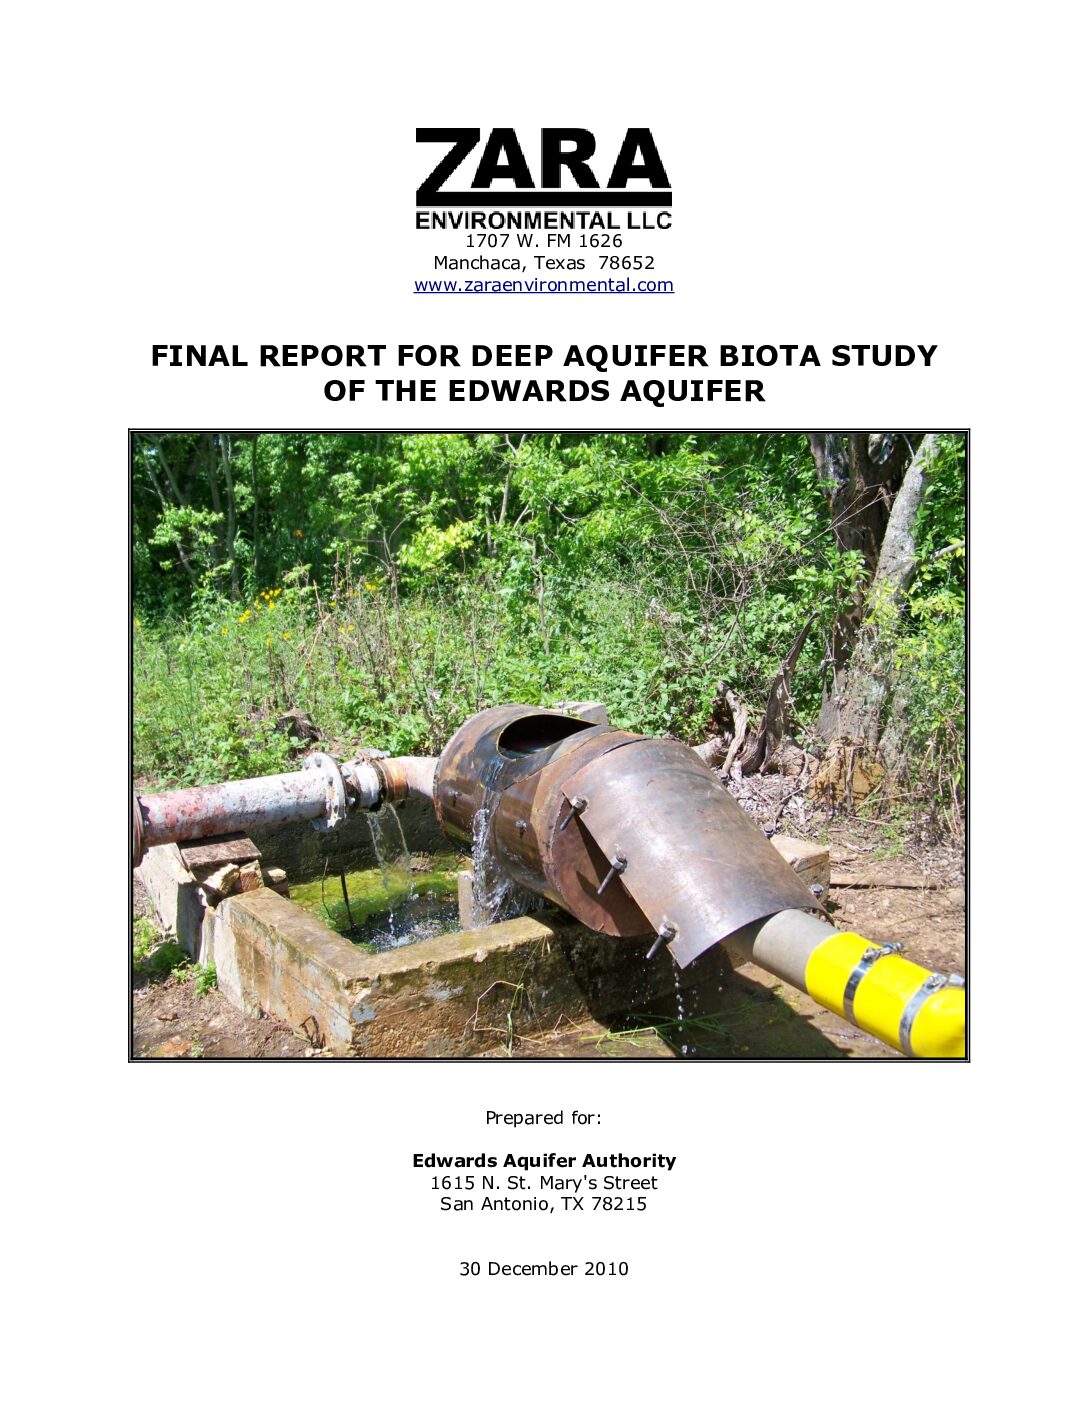
Description: Deep-aquifer biota study in five counties of the Edwards Aquifer
Location: Edwards Aquifer, Balcones Fault Zone, San Antonio Segment, Uvalde County, Medina County, Bexar County, Comal County, Hays County
Summary:The Edwards Aquifer, world renowned for its bio diversity, provides habitat to a variety of subterranean aquatic species ranging from blind salamanders to eyeless catfishes to ghost white shrimp. This report describes the results of a study of aquatic animals that reside in the deep zones of the Edwards Aquifer, primarily near the fresh water/saline water interface. Through cooperation with landowners across five counties, biologists from Zara Environmental Inc., sampled 43 wells between 2008 and 2010 for aquifer organisms.
Highlights of the study include:
- collecting specimens and adding new locality records for both species of blind catfishes, which have not been documented since 1978
- obtaining samples and coordinating with laboratories to gather the first ever genetic analyses of blind catfish
- discovering the first deep aquifer Eurycea salamander from Bexar County and providing that material to geneticists and morphologic taxonomists
- discovering 20 new localities for aquifer crustaceans
- documenting an entire order of fauna (Bathynellacea) previously unknown in the Edwards Aquifer; and
- discovering a species of copepod previously unknown to science, (Diacyclops sp.) from two sites.
In addition, biologists obtained samples that will be used for organic carbon analyses and stable isotope analyses by other researchers. They also developed an in-line sampler design for situations where water delivery from well casing to outlet is in an entirely closed system.
Assessment of Factors Influencing Texas Wild-Rice (Zizania texana) Sexual and Asexual Reproduction
Description: Laboratory and field studies on critical determinants of reproduction in Texas Wild-Rice (Zizania texana)
Location: San Marcos River
Summary:The purpose of this study was to identify factors that influence sexual and asexual reproduction of Texas Wild-rice (Zizania texana). Data collected during the study were used to examine the characteristics of pollen viability and dispersal, stigma viability, ability to self-pollinate, seed production and quality, minimum distances for successful pollination within and among stands, and asexual output. New information regarding pollination success and seed production for Texas Wild-rice was documented. The study was completed in June 2004 by the U.S. Fish and Wildlife San Marcos National Fish Hatchery and Technology Center and the Lady Bird Johnson Wildflower Center.
[Excerpted from the Executive Summary]
The three-year study was designed to identify factors that influence sexual and asexual reproduction in Texas wild-rice (Zizania texana). Four manipulative studies, a field survey, and a compilation of existing seed harvest data (1999 2003) were used to examine the characteristics of pollen viability and dispersal, stigma viability and receptivity, ability to self-pollinate, seed production and quality, minimum distances for successful pollination within and among stands, and asexual output.
The combined information in the chapters of this report creates a description of the reproductive biology of Z. texana. Pollen is released during the relatively cool morning hours (between 0200 and 0400) and is short lived (
It can be inferred that successful pollination would occur in large stands with less than 1 m gaps between stands. Gaps greater than 1 m would limit gene flow between stands. Based on the field survey, few individual Z. texana plants grow in isolation and most plants have other Z. texana as neighbors. This is to be expected in a clonal, wind pollinated species. Results from Chapters 2 and 5, together with TPWD's monitoring of the wild population, suggest that a critical impediment to sexual reproduction occurs at the pollination stage. Fragmentation of stands, gaps between stands, and damaged culms all contribute to failure at the pollination stage. The notable exception to reproductive failure occurs in Sewell Park, where seeds were produced from 1998 to 2004, where the stands are larger and the gaps between stands are smaller relative to the rest of the population.
Updates to the MODFLOW Groundwater Model of the San Antonio Segment of the Edwards Aquifer
Description: MODFLOW groundwater model springflow in the Edwards Aquifer Balcones Fault Zone San Antonio Segment and Barton Springs segment
Location: Edwards Aquifer, Balcones Fault Zone, San Antonio Segment, Barton Springs segment
Summary:This report documents recent updates and recalibration of the MODFLOW groundwater model of the San Antonio segment of the Edwards Aquifer. Conceptual and structural updates include addition of spring outflows and hydrologic flow barriers, removal of explicit conduits, elimination of the Barton Springs segment, new top and bottom layer elevations, and use of explicit well locations to represent pumping. The updated model was calibrated to match observed water levels and spring flows at the end of each month for the period of January 2001 through December 2011. Calibration errors in the updated model met the goals set prior to beginning the update and calibration process. As a validation test, the model was run forward to include years 2012 through 2015, which were not used in the calibration; the model reasonably matched observations for those years, although the overall errors were somewhat greater than for the period it was calibrated to. The model also reasonably matched observations for a drought-of-record simulation of years 1947 through 1958. Uncertainty in recharge is believed to be a significant factor contributing to model error.
The Edwards Underground Reservoir and the Edwards Underground Water District
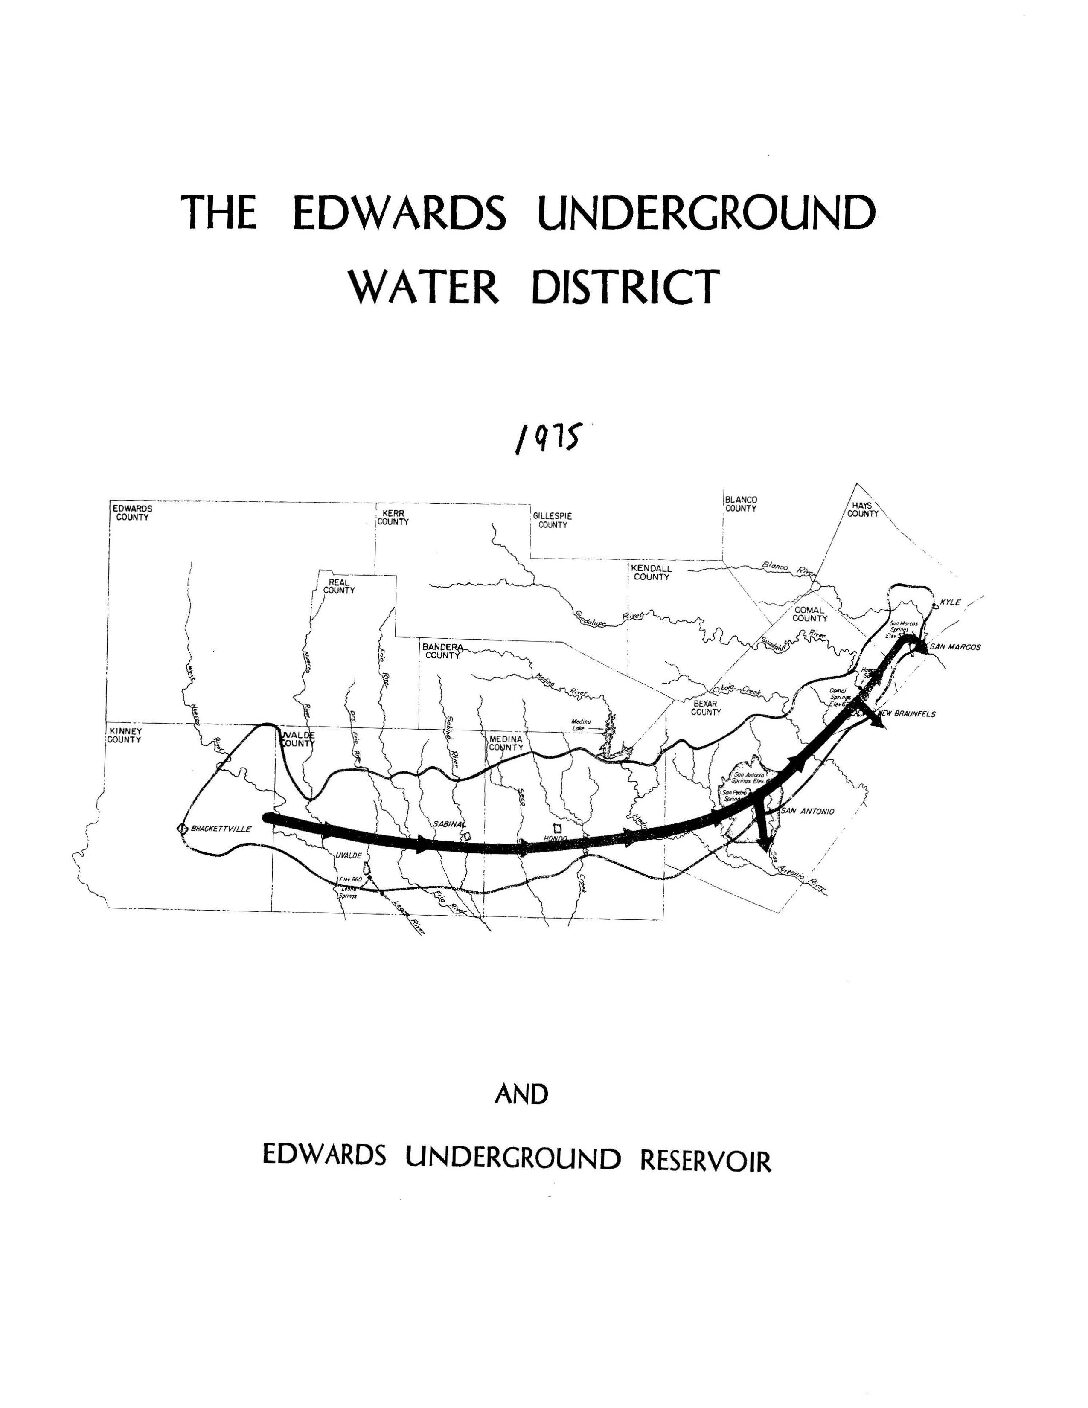
Description: General description of the Edwards Aquifer and current concerns and acts of regulatory agencies in 1975. This document is included for its historical value and information may no longer be current.
Location: Edwards Underground Water District Jurisdiction
Summary:General description of the Edwards Aquifer and current concerns and acts of regulatory agencies in 1975. This document is included for its historical value and information may no longer be current.
Appendix C of Edwards Aquifer Authority Hydrologic Data Report for 2013
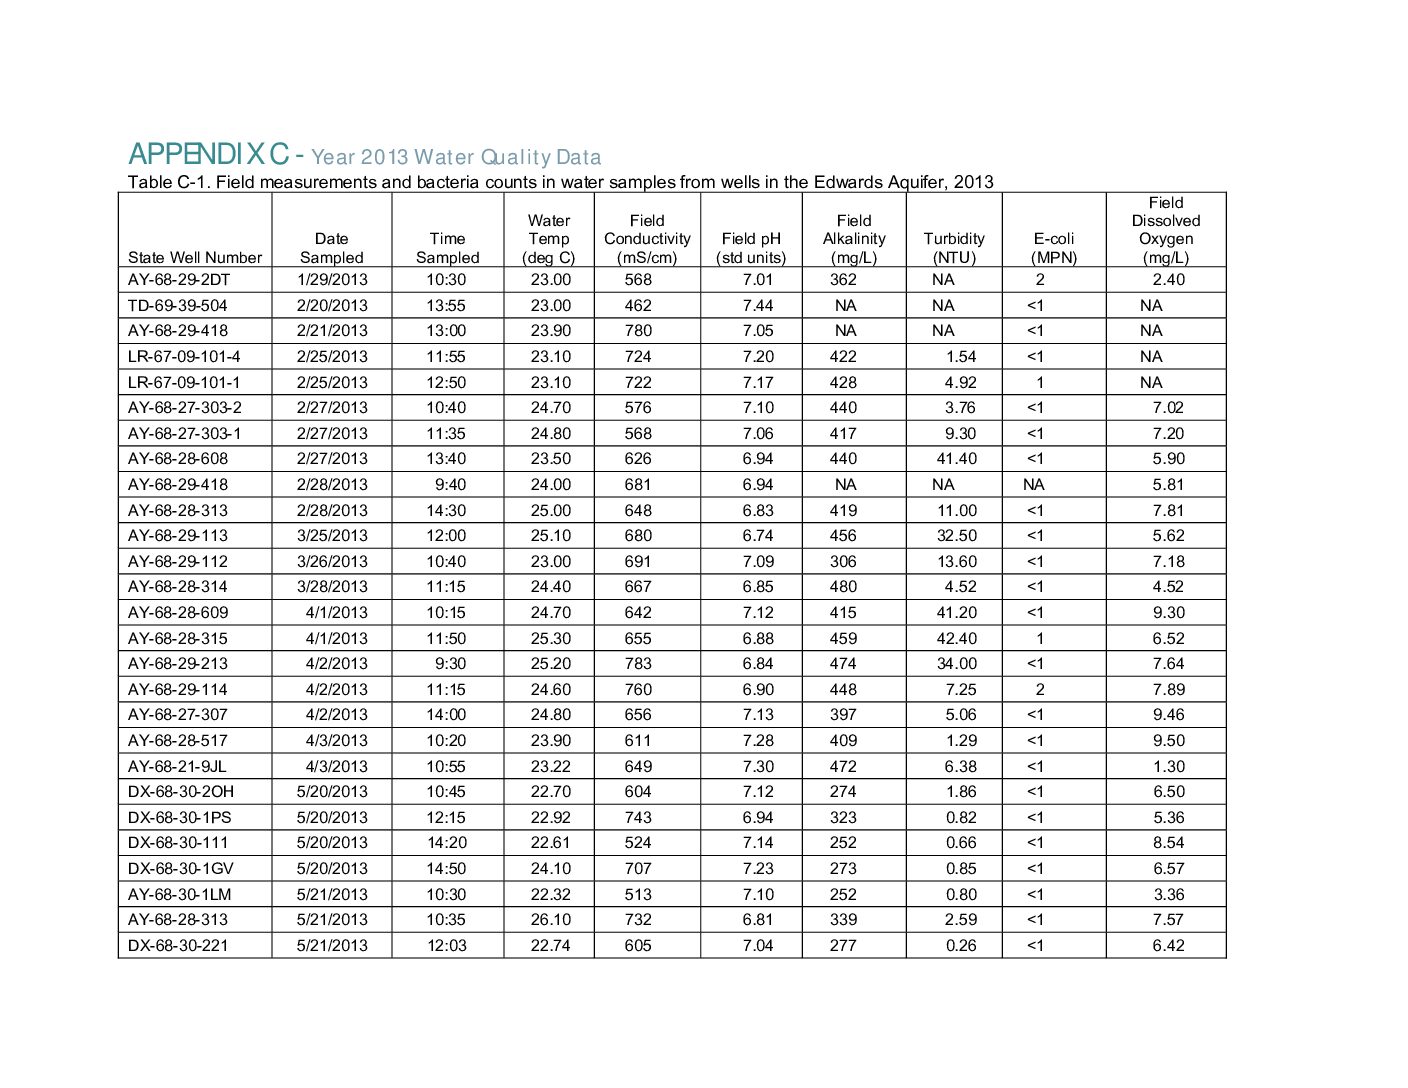
Description: Appendix C of annual report for 2013 on recharge, discharge, water levels and water quality in the Edwards Aquifer San Antonio Region
Report Number: Appendix C
Location: Edwards Aquifer-San Antonio Region
Summary:This report presents results of the Edwards Aquifer Authority's (EAA's) Edwards Aquifer Data Collection Program for calendar year 2013. The report also provides a summary of events that were considered significant and that may have affected the Edwards Aquifer during the year. During 2013, the EAA collected a wide variety of Edwards Aquifer related data, including: Groundwater level data; Precipatation measurement data; Groundwater recharge data; Groundwater discharge and usage data; and Water quality data from groundwater, surface water, and springs
Edwards Aquifer Authority Hydrologic Data Report for 2013
Description: Annual report for 2013 on recharge, discharge, water levels and water quality in the Edwards Aquifer San Antonio Region
Report Number: 14-02
Location: Edwards Aquifer-San Antonio Region
Summary:This report presents results of the Edwards Aquifer Authority's (EAA's) Edwards Aquifer Data Collection Program for calendar year 2013. The report also provides a summary of events that were considered significant and that may have affected the Edwards Aquifer during the year. During 2013, the EAA collected a wide variety of Edwards Aquifer related data, including: Groundwater level data; Precipatation measurement data; Groundwater recharge data; Groundwater discharge and usage data; and Water quality data from groundwater, surface water, and springs
Edwards Aquifer Hydrogeologic Report for 1998
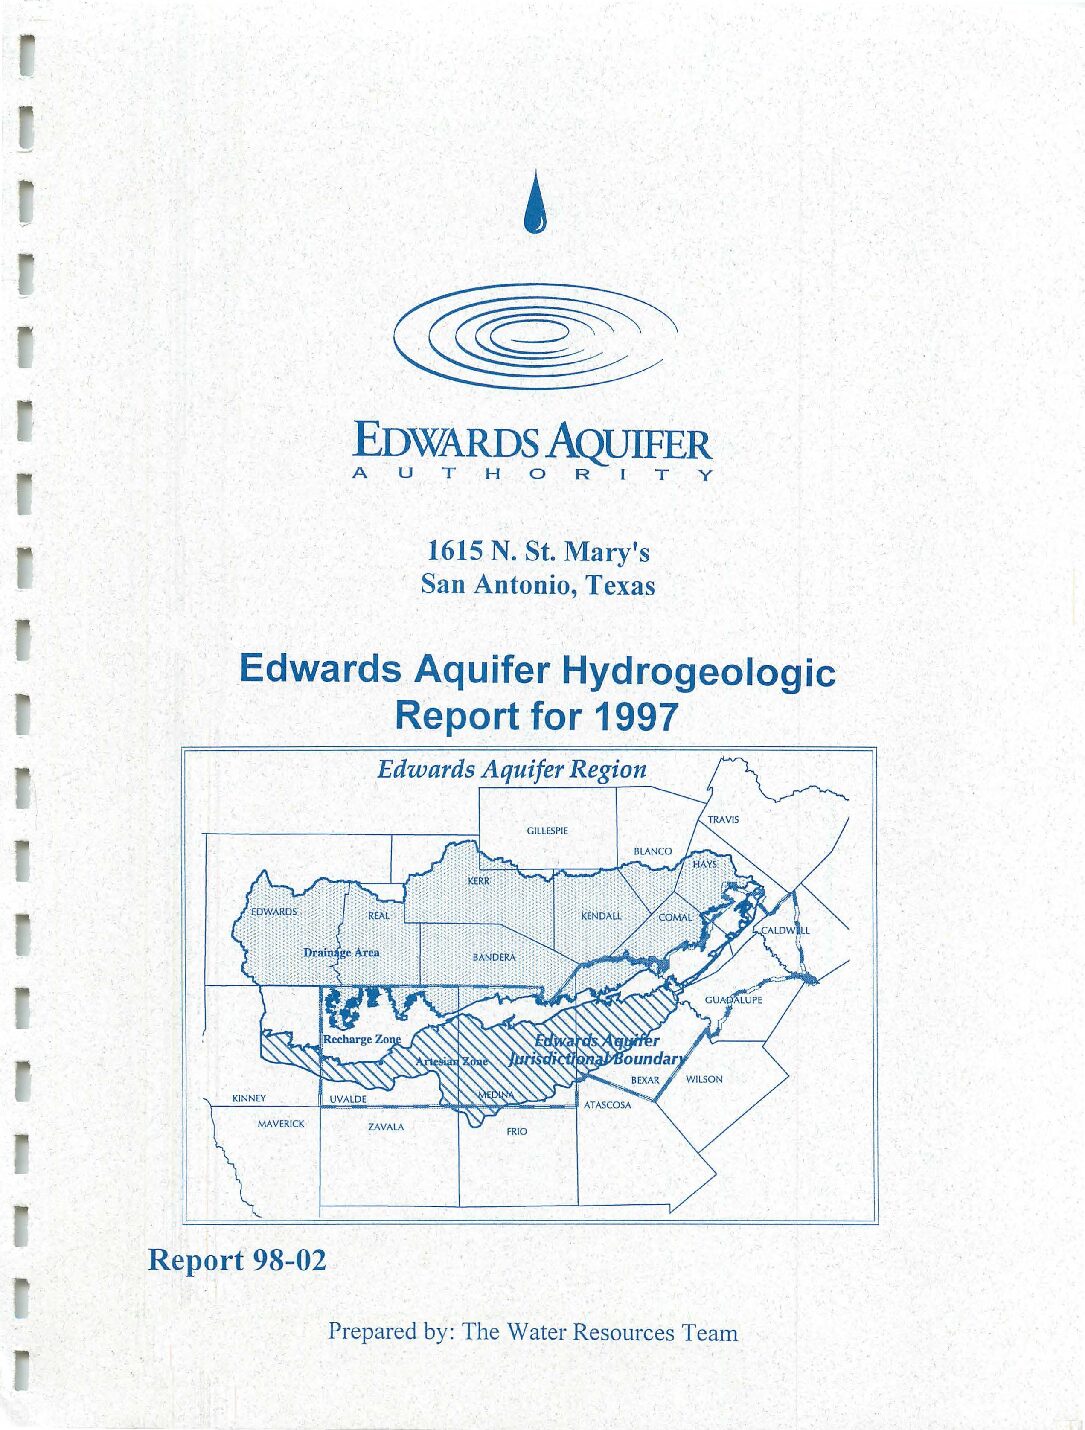
Description: Annual report for 1998 on recharge, discharge, water levels and water quality in the Edwards Aquifer San Antonio Region
Report Number: 99-02
Location: Edwards Aquifer - San Antonio Area
Summary:The average estimated annual groundwater recharge to the Edwards Aquifer in the San Antonio region from 1934 through 1998 was approximately 683,100 acre-feet. Recharge in 1998 was approximately 1,142,300 acre-feet, which was well above the regional average. The lowest annual recharge of 43,700 acre-feet occurred in 1956, and the highest annual recharge of 2,486,000 acre-feet occurred in 1992.
Estimated annual discharge from the Edwards Aquifer through wells and springs in 1998 was 917,600 acre-feet. The lowest annual discharge through wells and springs was 388,800 acre-feet, which occurred in 1955. Spring discharge from the Edwards Aquifer for 1998 was calculated at 464,100 acre-feet or 51 percent of the total discharge. Groundwater pumping accounted for 453,500 acre-feet of water discharged from the Edwards Aquifer in 1998. In general, water level data during 1998 reflected a slight increase in water recharging the aquifer, as well as an increase in pumping relative to 1997.
Results of the Authority's 1998 water quality monitoring program illustrate the continued excellent quality of water in the Edwards Aquifer. In 1998, the Authority collected water quality samples from wells, springs and stream basins, which were analyzed for major ions, nutrients, minor element metals, pesticides, herbicides, and VOC's. Laboratory analyses of samples from several wells contained minor element metal concentrations slightly above the MDL. No
compounds were detected in 1998 above MCL concentrations. Laboratory analyses of the surface water samples collected in 1998 indicated no detectable concentrations of pesticides, herbicides, or VOC's. Overall, results of the 1998 water quality sampling and analysis program illustrate the continued excellent quality of water in the Edwards Aquifer.
Edwards Aquifer Hydrogeologic Report for 1996
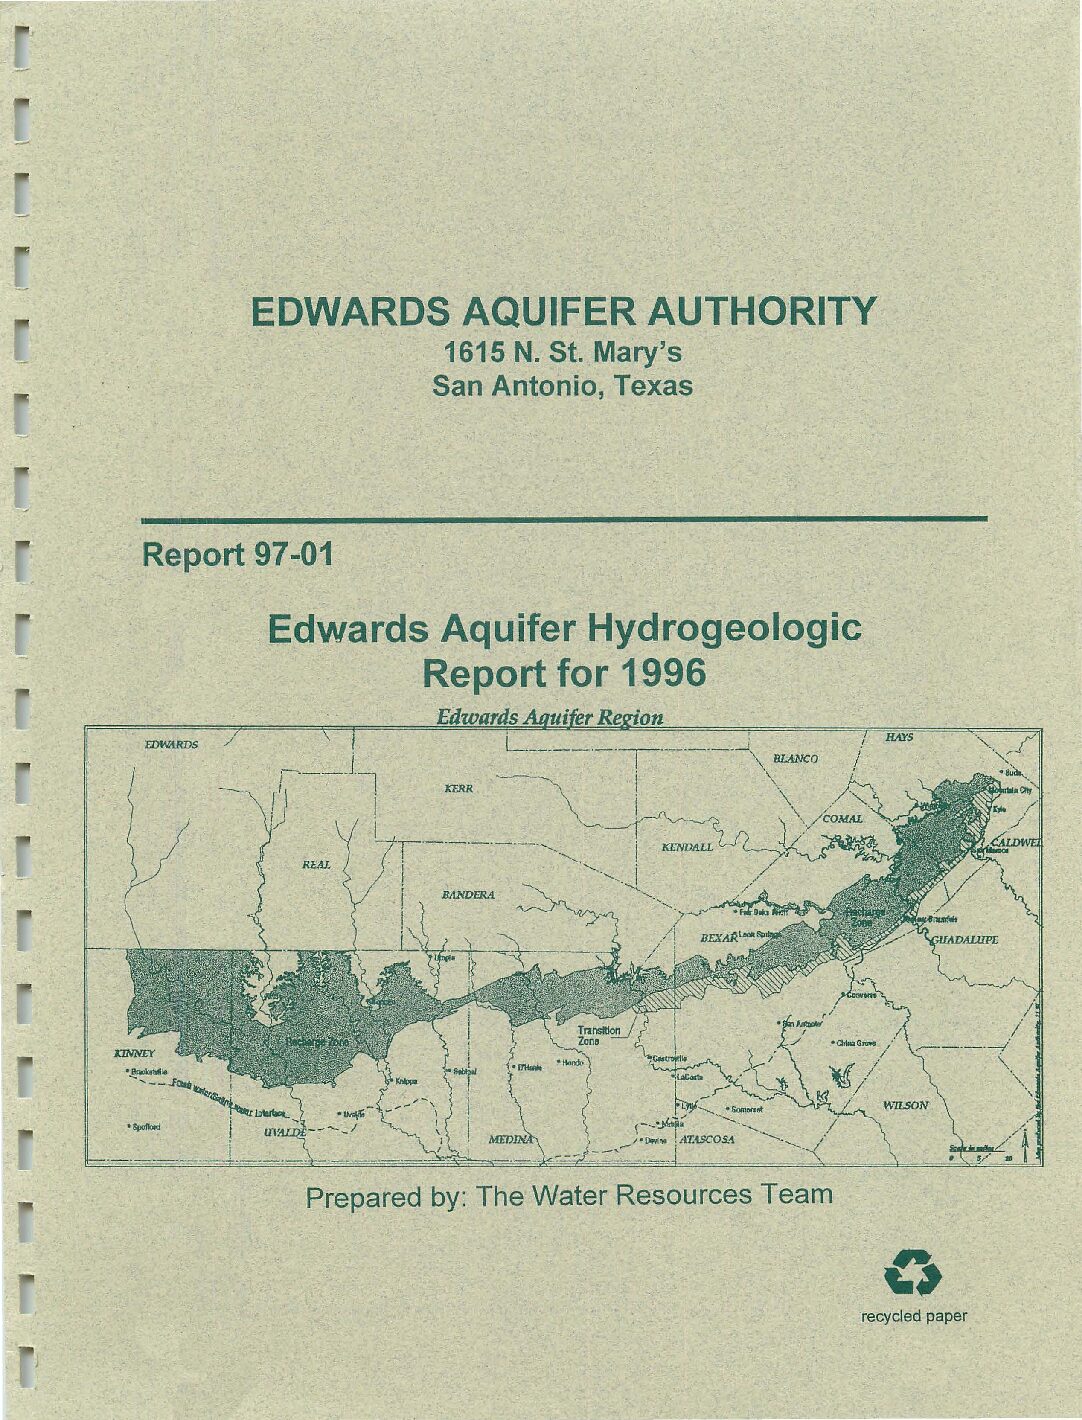
Description: Annual report for 1996 on recharge, discharge, water levels and water quality in the Edwards Aquifer San Antonio Region
Report Number: 97-01
Location: Edwards Aquifer Balcones Fault Zone San Antonio Segment
Summary:The average estimated annual groundwater recharge to the Edwards Aquifer in the San Antonio area from 1934 through 1996 was 668,700 acre-feet. Recharge in 1996 was 324,300 acre-feet, which was well below the regional average. The lowest annual recharge of 43.700 acre-feet occurred in 1956, and the highest annual recharge of 2,486,000 acre-feet occurred in 1992.
The estimated annual discharge from the Edwards Aquifer through wells and springs in 1996 was 705,600 acre-feet. The lowest annual discharge through wells and springs was 388,800 acre-feet, which occurred in 1955.
Water-level data during 1996 reflected a general decrease in water recharging the aquifer and an increase in pumping during the year.
Results of the Authority's 1996 water-quality monitoring program illustrate the continued excellent quality of water in the Edwards Aquifer. In 1996, the Authority collected water-quality samples from wells, springs and stream basins, which were analyzed for major ions, minor elements, pesticides, herbicides, volatile organics/aromatics and nutrients. Laboratory analyses of well samples indicated no detectable levels of any volatile organic compounds. Laboratory analyses of samples from several wells contained minor element concentrations slightly above the minimum analytical detection limit for these constituents. but these values are extremely low in magnitude. Laboratory analyses of the surface water samples collected in 1996 indicated no evidence of detectable concentrations of pesticides, VOCs or other constituents or parameters in excess of typical standards.
Edwards Aquifer Hydrogeologic Report for 1996-Plates
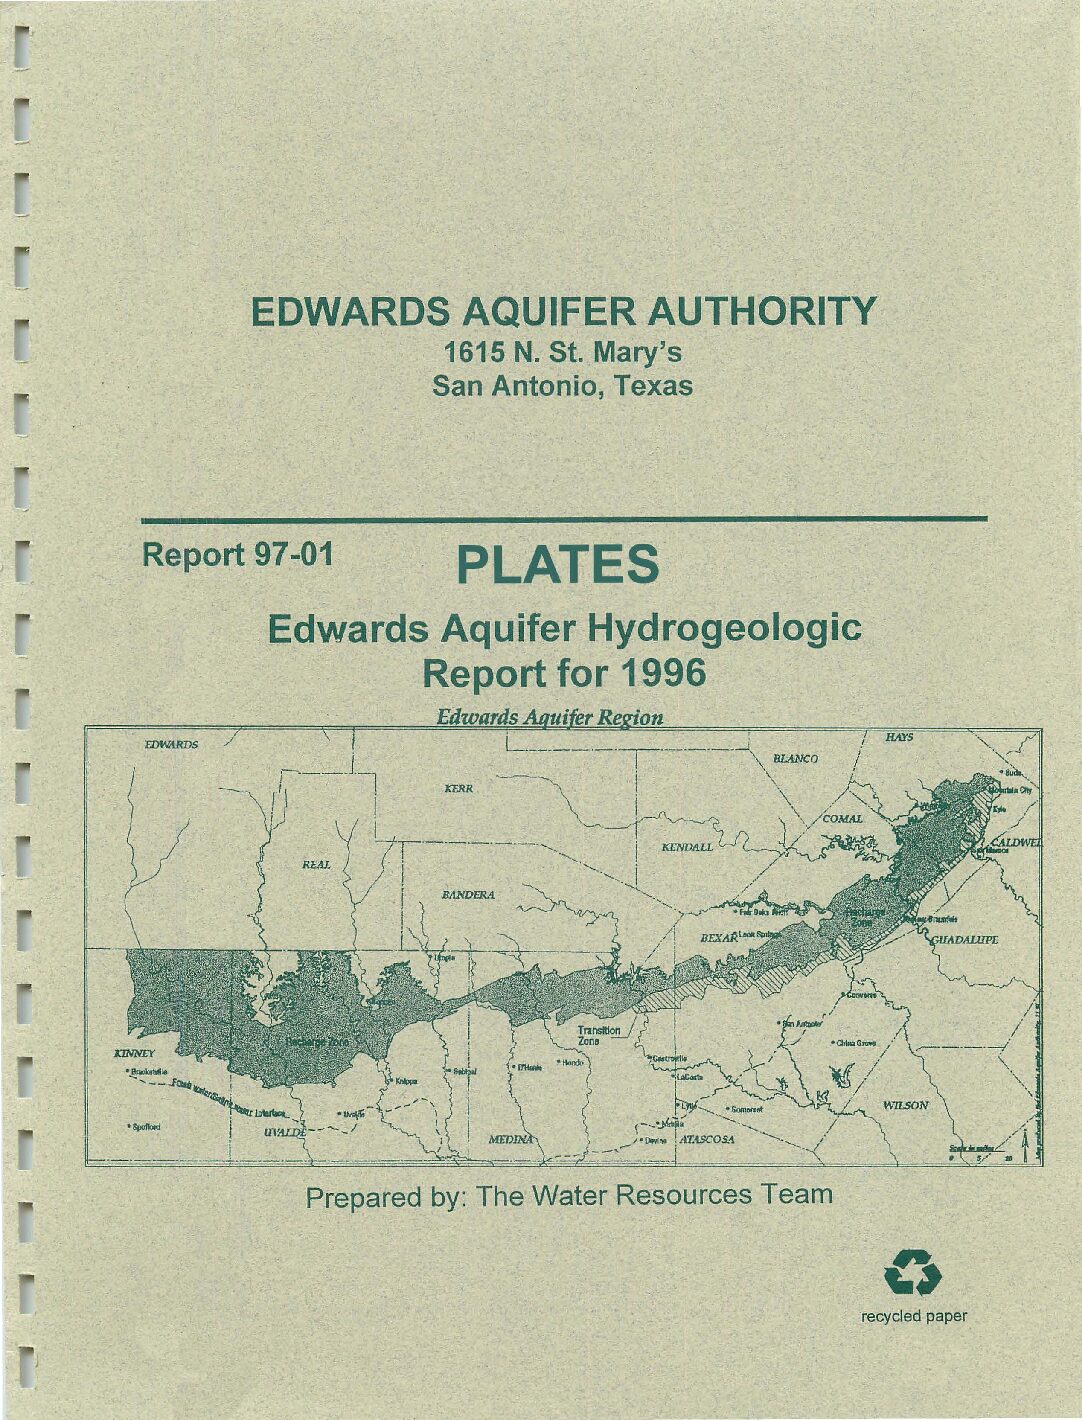
Description: Large-format plates for Edwards Aquifer Hydrogeologic Report for 1996. See companion document.
Report Number: 97-01
Location: Edwards Aquifer Balcones Fault Zone San Antonio Segment
Summary:Large-format plates for Edwards Aquifer Hydrogeologic Report for 1996. See companion document.
1991 Hydrologic Data Report Compilation of Hydrologic Data for the Edwards Aquifer, San Antonio Area, Texas, 1991, with 1934-91 Summary-Plates
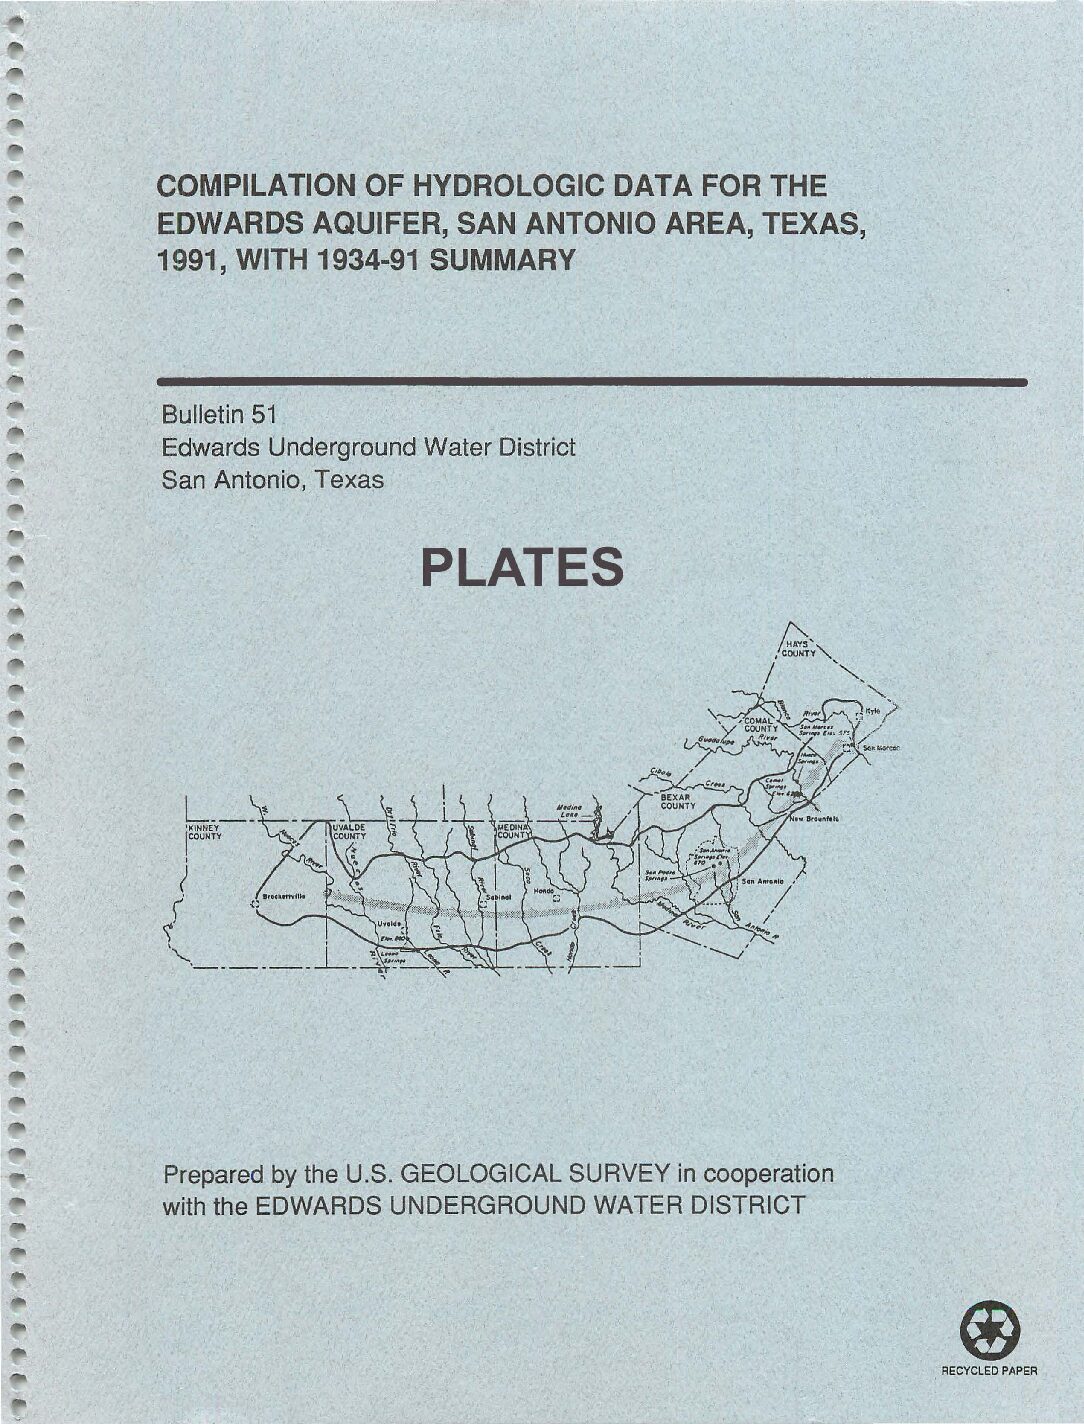
Description: Large-format plates for the 1991 Hydrologic Data Report. See companion document.
Report Number: Bulletin 51
Location: Edwards Aquifer Balcones Fault Zone San Antonio Segment
Summary:Large-format plates for the 1991 Hydrologic Data Report. See companion document.
Edwards Aquifer Authority Hydrologic Data Report for 2012 / Report No. 13-01
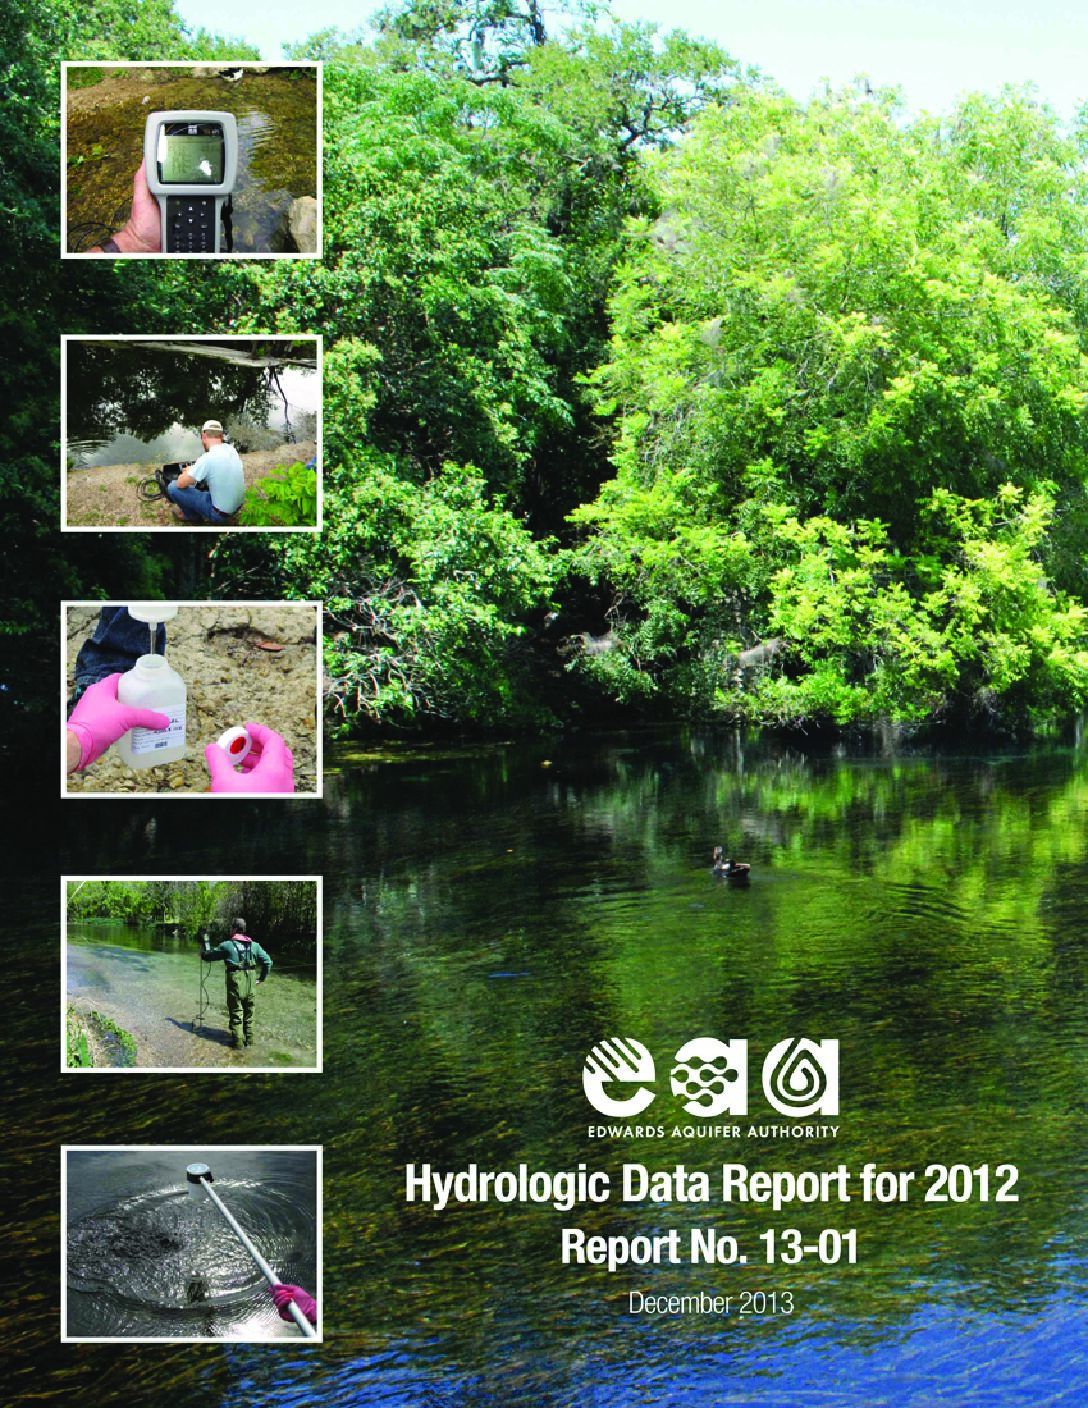
Description: Annual report for 2012 on recharge, discharge, precipitation, water levels and water quality in the Edwards Aquifer Balcones Fault Zone San Antonio Segment
Report Number: 13-01
Location: Edwards Aquifer Balcones Fault Zone San Antonio Segment
Summary:This report presents results of the Edwards Aquifer Authority's (EAA's) Edwards Aquifer Data Collection Program for calendar year 2012. During 2012, the EAA collected a wide variety of Edwards Aquifer data, including
*Groundwater level data;
*Precipitation measurement data;
*Groundwater recharge data;
*Groundwater discharge and usage data;
*Water quality data from groundwater,
surface water, and springs; and
*Significant events affecting the
Edwards Aquifer.
Water levels at the Bexar County (J-17) index wellwere below the historical mean for the entire year. The maximum level of 666.8 feet above msl at J-17 occurred during March, and the low of 637.6 feet above msl occurred in August.
Other wells in the region exhibited similar behavior with regard to lower than normal water levels. The Comal County observation well had an annual high water level slightly above the historical mean high. However, for most of the year, this well also exhibited lower than normal water levels.
In 2012, rainfall amounts were above the mean in Bexar, Comal, and Hays counties and below the mean in Medina and Uvalde counties. In general, the region received between 60 and 129 percent of normal precipitation during the year, with the west receiving the lower rainfall totals and the east receiving the higher rainfall totals.
Total estimated recharge to the Edwards Aquifer was below normal in 2012. Recharge for the year was estimated at 313,500 acre-feet, compared with the period-of-record (1934“2012) median annual recharge value of 556,900 acre-feet. Recharge in 2012 was below the period-of-record median value for all basins, except for the Blanco River Basin, which was above the median.
In calendar year 2012, total groundwater discharge from the Edwards Aquifer through wells and springs was estimated at 687,033 acre-feet. This amount is below the median total discharge of 692,900 acre-feet for the period of record (1934“2012).
Discharge from wells in 2012 was estimated to be 384,685 acre-feet, approximately 56,885 acre-feet above the 327,800 acre-foot period of record (1934“2012) median. The lowest annual estimated discharge from wells for the period of record was 101,900 acre-feet in 1934, and the highest was 542,400 acre-feet in 1989.
Discharge from springs in 2012 was estimated at 302,348 acre-feet, somewhat below the period of record median of 379,900 acre-feet. The lowest annual discharge from springs for the period of record (1934“2012) was 69,800 acre-feet in 1956, and the highest was 802,800 acre-feet in 1992. Spring discharge in 2012 was the fifteenth lowest discharge on record.
In 2012, the EAA collected water quality samples from 95 wells (some wells sampled multiple times), 12 streams (some sampled in more than one location), and five spring groups. Samples collected for the year are summarized below by sample type and location.
Sample-Collection Summary, Calendar Year 2012
Bacteria Samples
*313 samples collected at 77 wells
*79 samples collected at four spring groups
*20 samples collected at 11 stream sites
Metals Samples
*110 samples collected at 64 wells
*82 samples collected at five spring groups
*17 samples collected at ten stream sites
Nitrate-Nitrite as Nitrogen
*351 samples collected at 91 wells
*81 samples collected at five spring groups
*20 samples collected at 11 stream sites
Volatile Organic Compounds
*102 samples collected at 61 wells
*82 samples collected at five spring groups
*one sample collected at one stream site
Semivolatile Organic Compounds
*29 samples collected at nine wells
*80 samples collected at four spring groups
*Three samples collected at three stream sites
Pesticide and/or Herbicide Compounds
*43 samples collected at 37 wells
*82 samples collected at five spring groups
*17 samples collected at ten stream sites
Polychlorinated Bi-Phenyls
*39 samples collected at 36 wells
*82 samples collected at five spring groups
*17 samples collected at ten stream sites
Pharmaceuticals and Personal Care Products
*Seven samples collected at seven wells
*Three samples collected at three spring groups
*Two samples collected at two stream sites
In calendar year 2012, seven sanitary sewer system overflows occurred in Bexar County, the volume of one of which was considered significant, one moderate, three minor, and two negligible. The significant overflow occurred in October, the moderate in March, and the remaining five in April, May, September, and December (two). The largest overflow, approximately 111,350 gallons, occurred between October 14 and 15 east of Bulverde Road near the Santa Lucia and Montebello Road intersection in northern Bexar County. The moderate overflow, approximately 84,500 gallons, occurred on or about March 7 near Cloud Top Road, west of Blanco Road in northern Bexar County. The remaining overflows, which ranged between approximately 1,500 and 17,500 gallons per event, occurred between IH-10 to the west, and U.S. 281 to the east, both north and south of Loop 1604. The EAA responded to each event, taking a series of samples for the major and moderate events to determine whether a bacterial plume could be detected in the Edwards Aquifer.
The Edwards Underground Reservoir [Trifold Brochure and Map]
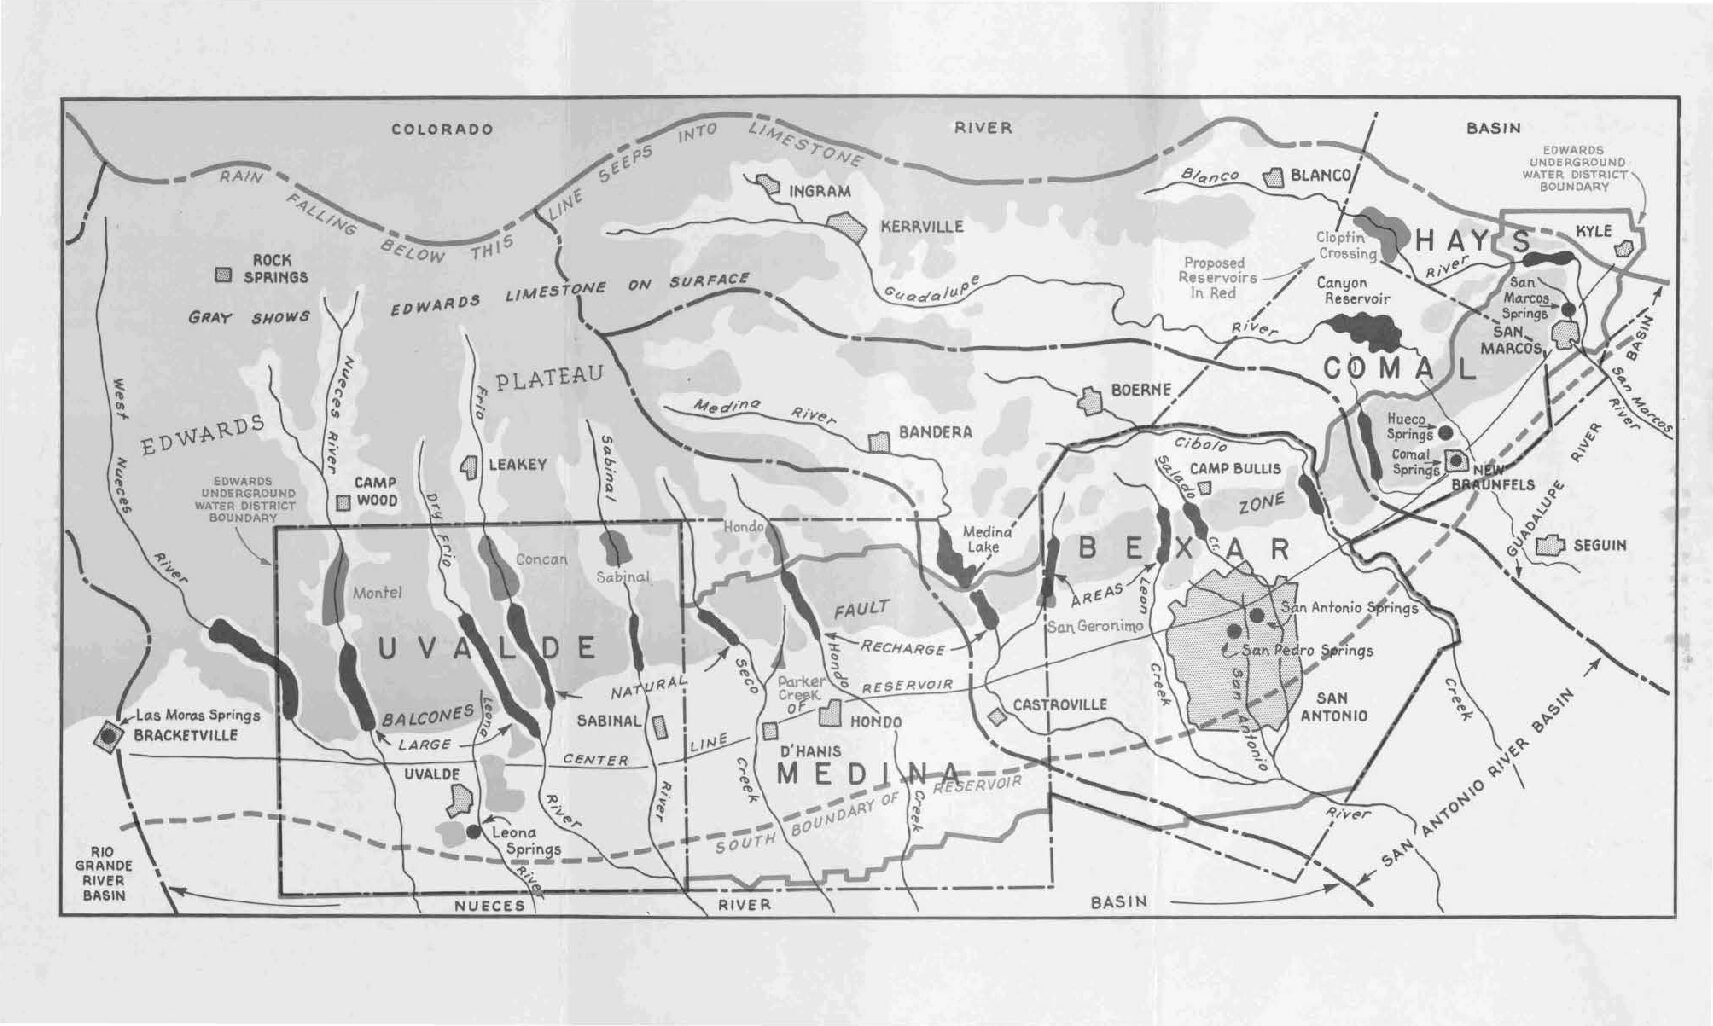
Description: Map and summary of the Edwards Aquifer and Edwards Underground Water District. Note: this information is no longer current but is included for historical value.
Location: Edwards Aquifer
Summary:Map and summary of the Edwards Aquifer and Edwards Underground Water District. Note: this information is no longer current but is included for historical value.
Suggested Design and Construction of Edwards Aquifer Wells
Description: Guide for domestic well owners. Note: This document is included for historical interest and may have been replaced by more recent guidelines.
Location: Edwards Aquifer
Summary:Note: This document is included for historical interest and may have been replaced by more recent guidelines.
Edwards Underground Water District has developed these recommended minimum well construction standards. The method used to construct Edwards' wells, and the construction details themselves can be a major factor in the quality and quantity of water being produced. The unique nature of the Edwards Aquifer as a limestone formation has made water well construction specialized and different from that in all other areas of the State. This manual is provided as a service to the residents of the District to inform those unfamiliar with the water well profession about generally accepted drilling procedures, practices, and construction specifications for Edwards Aquifer wells. It primarily addresses the construction of domestic wells.
The suggested water well design and construction information presented herein is provided for educational purposes in an effort to improve upon individual home water supply systems. There is a wide range of variables affecting the type of construction necessary from one well to the next. Any unusual situation many times will require a decision to be made on the spot which may alter the construction of the well not covered in this manual.
The location of a well will also be a deciding factor in the quality and quantity of water capable of being produced. It is recommended that prior to drilling a well, the individual having the well drilled, obtain all available information on the geology and groundwater resources of the area. Much of this information can be obtained from nearby well owners, water well drillers or public agencies.
The Edwards Underground Water District (now the Edwards Aquifer Authority) maintains records of new and historical well data which is made available to the general public.
Edwards Aquifer Hydrogeologic Report for 1997-Plates
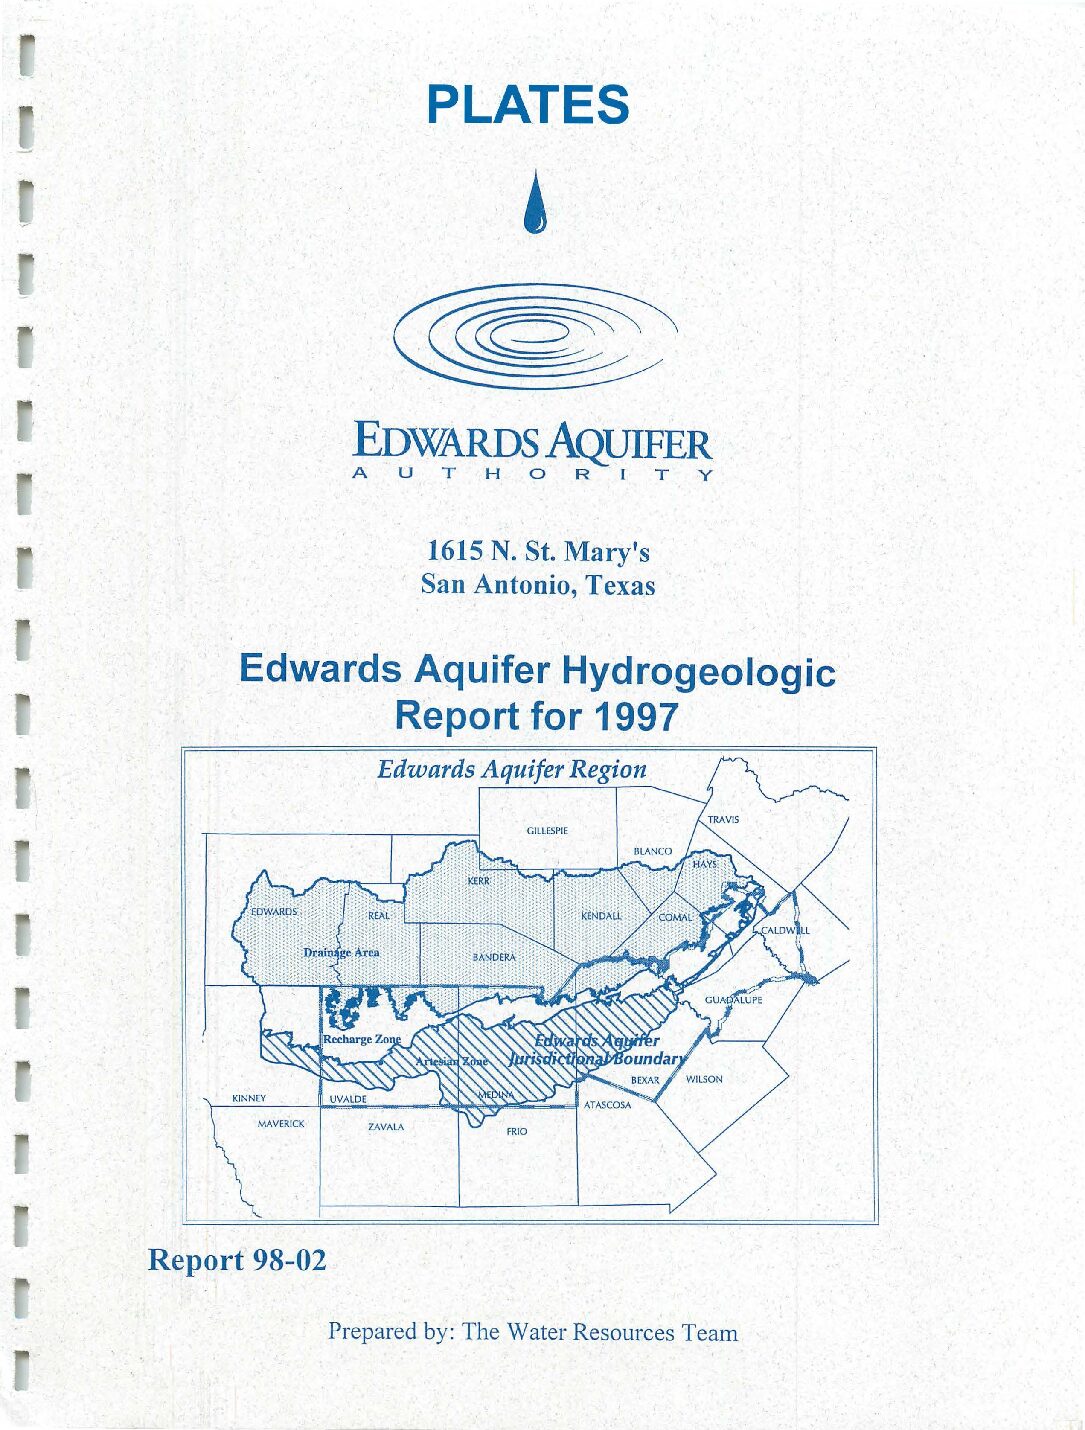
Description: Large-format plates for Edwards Aquifer Hydrogeologic Report for 1997. See companion document.
Report Number: 98-02
Location: Edwards Aquifer Balcones Fault Zone San Antonio Segment
Summary:Large-format plates for Edwards Aquifer Hydrogeologic Report for 1997. See companion document.


