 Conditions
Science & Data Document Library
Science and Data Resources
Analysis of Data from Test-Well Sites along the Downdip Limit of Freshwater in the Edwards Aquifer, San Antonio, Texas, 1985-87
Description: Geochemical and hydrochemical study of the Edwards Aquifer downdip area and saline-freshwater interface in the San Antonio area
Report Number: USGS WRIP 93-4100
Location: Edwards Aquifer, Balcones Fault Zone, San Antonio Segment, Downdip
Summary:Many researchers have studied the downdip limit of freshwater in the Edwards aquifer or various aspects of the saline-water zone and its relation to the freshwater zone. These studies were summarized and used to synthesize a consistent hydrologic and geochemical framework from which to interpret data from field studies. The concept derived from the previous work on the downdip limit of the freshwater zone is that fresh recharge water entered the aquifer and developed a vast flow system controlled by barrier faults.
Some recharge water flows into the saline-water zone rather than toward major freshwater discharge points. The water that enters the saline-water zone continues to dissolve gypsum and dolomite, and calcite precipitates out of the water.
This process of dedolomitization has helped to develop the large secondary porosity of the freshwater zone as the downdip limit of the freshwater zone progressively moved downdip in recent geologic time.
The drilling of test holes and installation of monitoring wells began in 1985 and helped to define the downdip limit of the freshwater zone at one location. Dolomite was found in greater amounts in rocks from the saline-water-zone test hole than in rocks from the freshwater-zone test hole. Other mineralogic and lithologic contrasts between the saline-water-zone test hole and the freshwater-zone test hole support the conceptual model of dedolomitization. Geophysical logs and test-hole survey logs helped to define the stratification of freshwater and associated altered rock textures, secondary porosity development, and water chemistry in the freshwater-, saline-water-, and transition-zone test holes.
The differences in actual measured head among the seven completed monitor wells varied over time, especially during periods of substantial water use. The water levels in two monitor wells completed at the freshwater zone (siteD; wells Dl and D2) responded quickly and strongly to withdrawals. In the transition zone (site C; wells C1and C2), the water level in the shallow monitor well (C1) completed in a cavern responded quickly, but because it was farther from the water-supply wells near site D, it did not respond as strongly to changes in withdrawals at the nearby well field. The water levels in the three saline-water wells at site A (A1, A2, and A3) and the deep site C well (C2) were less responsive to stresses relative to the water-level changes in the freshwater wells (D1, D2, and C1).
Large amounts of freshwater were produced from the upper 300 to 350 feet of the aquifer in the freshwater zone (site D). Water produced from below this interval was as saline as that from the saline-water zone (site A). The cavern near the top of the aquifer in the transition zone (site C) produced large amounts of freshwater. The freshwater produced from the cavern was of a different geochemical type than the water from the other wells.
The saline-water-zone test hole (site A) produced small amounts of water having specific conductance generally about 5,800 to 6,200 microsiemens per centimeter at 25 degrees Celsius. A consistent trend in the water quality was not detected in the monitor-well data for July 1986-April 1987. This was caused, in part, by the average to above-average rainfall and by the lack of large withdrawals during the period. The water quality of samples from several of the wells was similar to the water quality determined by a previous study of the area. Geochemistry of the oil- or gas-well brines from downdip in the saline-water zone had slight resemblance to the geochemistry of the water at the downdip limit of freshwater; updip flow of saline water toward the freshwater zone was not indicated.
Environmental Tritium in the Edwards Aquifer Central Texas 1963-71
Description: Analysis of tritium in 50 wells and springs in the San Antonio area
Report Number: USGS O-FR 74-362
Location: Edwards Aquifer, Balcones Fault Zone, San Antonio Segment
Summary:Tritium concentrations of samples from 50 wells and springs in the Edwards aquifer in the San Antonio area of Texas have been analysed. Tritium now in the aquifer is partly natural cosmic ray produced tritium, but most is tritium produced by atmospheric thermonuclear tests in the 1950's and early 1960's. The tritium levels in atmospheric precipitation and streams recharging the Edwards are presented for comparison with the ground-water data.
In general, tritium distribution within the Edwards confirms the accepted pattern of water flow within the aquifer. Concentrations of greater than 20 tritium units occur in the recharge areas, while less than 1 tritium unit is present along the aquifer's southern and southeastern boundary.
Investigation of the Fresh/Saline Water Interface in the Edwards Aquifer in New Braunfels and San Marcos, Texas Report
Description: Attempts to define the freshwater/saline water boundary and its movement in the New Braunfels/San Marcos area from monitoring well data - Report
Report Number: 92-02
Location: Edwards Aquifer, Balcones Fault Zone, San Antonio Segment, New Braunfels, San Marcos
Summary:Two well transects, one In New Braunfels and one In San Marcos, were drilled for the purpose of: 1) collecting hydrogeologic data regarding the Interface between the fresh and saline zones of the Edwards Aquifer; and 2) monitoring the movement of the interface over a long period of time. Water samples, drill cuttings, and conductivity measurements were collected at various Intervals during the drilling of each well. Thin sections were made from the drill cuttings and then analyzed. Pump tests and geophysical logging were also performed at each well at various depths within the Edwards Aquifer. The data and resulting analyses presented in this report, therefore, details the hydrogeologic setting at each transect slte, and lays a technical foundation for the long-term monitoring of the fresh/saline Interface, as well as for other hydrogeologic studies regarding the Edwards Aquifer.
For both sites, the transmissivity values were lower in the saline-water zone than in the fresh-water zone which corresponded with the lithology and porosity conditions observed in the geophysical logs, thin sections, and rock cutting descriptions. The water quality evidence also correlated with the trends related to the rock properties.
In addition, the petrographic evidence revealed that at both San Marcos and New Braunfels, the rock where the wells were drilled was once exposed to fresh water. The drilling of both transects proved that the fresh/saline boundary was much closer to the major springs than previously believed.
The most significant Information regarding the New Braunfels transect is that the interface between the fresh/saline zones was well defined and that a bottom saline layer persisted underneath the fresh-water zone where the wells were drilled. Thus, during some of the pump tests, the conductivity values in the wells increased. This change in water quality lead to a conservative conclusion that public supply wells in the same fault block should be monitored.
The San Marcos transect did not cross an interface between the fresh/saline zone, rather only saline water was found. The transect however, did reveal a trend of Increased transmissivity toward the San Marcos Springs Fault. Moreover, though the quality of water was saline in the well closest to this fault, the water quality did improve over time during some of the pump tests. This Is believed to be caused by the Increase of transmissivity near such a major fault. However, communication from the lower block, where the wells were drilled, up the San Marcos Springs Fault to the spring orifices have yet to be established.
Hydrogeologic Data from a Study of the Freshwater Zone/Salinewater Zone Interface in the Edwards Aquifer, San Antonio Region, Texas
Description: Initial hydrogeological study of the freshwater/saline water boundary and potential for saltwater intrusion in the Edwards Aquifer, Balcones Fault Zone, San Antonio Segment
Report Number: USGS O-FR 87-389
Location: Edwards Aquifer, Balcones Fault Zone, San Antonio Segment
Summary:The purpose of this study is to assess the potential for salinewater intrusion into the freshwater zone. The purpose of this report is to present hydrogeologic data collected during the test drilling and initial testing phase of the study. Information regarding flow tests, water quality, geophysical logs, and lithology are provided in this report. The study was conducted by the U.S. Geological Survey in cooperation with the San Antonio City Water Board, the Edwards Underground Water District, and the Texas Water Development Board.
Water samples were collected during each cumulative-depth flow test and interval flow test. Water-quality data collected include the field determination of pH, temperature, alkalinity, and specific conductance. Laboratory analyses include determination of inorganic concentrations of the major cations and anions. Results of laboratory analysis for the cumulative-depth flow tests and interval flow tests for wells A-1, C-1, and D-1, and from all seven completed monitor wells taken in March and July 1986, are listed in tables by well in the Hydrogeologic Data section of this report.
With the completion of drilling, testing, and monitor-well construction, a long-term (50 years) monitoring program is now in effect. Continuous water-level recorders have been installed on each well to establish a record of water-level fluctuations. Water-quality samples are being collected monthly for chemical analysis to establish a record of any variations in water quality.
Potential for Updip Movement of Salinewater in the Edwards Aquifer, San Antonio, Texas
Description: Modeling the shift of the freshwater-saline water interface under various conditions over a 10-year period
Report Number: USGS WRIR 86-4032
Location: Edwards Aquifer, Balcones Fault Zone, San Antonio Segment
Summary:The salinity front, locally known as the bad-water line, in the Edwards aquifer separates the freshwater from the salinewater and occurs where the aquifer is confined. The concentration of dissolved solids of the salinewater at the salinity front is 1,000 milligrams per liter. The concentration of dissolved solids in water within the freshwater zone of the aquifer usually ranges from 250 to 350 milligrams per liter. A digital model was used to investigate the potential movement of the salinity front by simulating the transport of salinewater into the freshwater zone as a result of pumping from the freshwater zone.
The model simulations indicate that a large range in the quantity of solute transported from the salinewater zone into the freshwater zone is possible. This uncertainty is caused by the range of estimates of transmissivity, the magnitude of water-level decline, and porosity. Simulated transmissivity values for the Edwards aquifer within the salinewater zone ranged from 134 to 3,340 feet squared per day and resulted in potential lateral shifts of the salinity front from 16 to 425 feet updip into the freshwater zone at the end of a 10-year simulation. A simulated decline in water levels from an altitude of 660 to 582 feet above sea level resulted in a potential lateral shift in the salinity front of 133 feet updip into the freshwater zone at the end of the 10-year simulation. Simulated porosity values from l to 20 percent resulted in lateral shifts of the salinity front from 42 to 854 feet updip into the freshwater zone at the end of the 10-year simulation. An evaluation of the results of the model simulations indicates that contamination created by the movement of salinewater into the freshwater zone of the Edwards aquifer will be limited to an area within 0.2 mile of the present salinity front under the tested conditions.
South Medina County Observation Well Project
Description: Drilling and evaluation of a new test well in South Medina County to refine the location of the freshwater / saline water interface in the Edwards Aquifer interface between San Antonio and Uvalde, Texas
Report Number: 93-11
Location: Edwards Aquifer, Balcones Fault Zone, San Antonio Segment, Medina County
Summary:In 1992, the Board of Directors of the Edwards Underground Water District released Report No. 92-03, written by Mr. Alvin L. Schultz. [qv] The report summarizes the results of a study designed to better define the freshwater/saline-water interface between San Antonio and Uvalde, Texas. Mr. Schultz utilized the evaluation of water quality data calculated from geophysical logs in order to determine that the freshwater/saline-water interface in this area is actually located further south than previously mapped.
Based on the results of the study, a location was chosen to evaluate Mr. Schultz's conclusions by drilling and testing an Edwards aquifer observation well in an area where the current and proposed interfaces were several miles apart. The well location was also chosen in an area with good geophysical log control, but with very little measured water quality data available. The referenced observation well location is in southwest Medina County (Figure 1), approximately four and one-half miles southwest of Yancey, Texas. The well is located approximately three miles south of the currently mapped interface.
The South Medina County well encountered fresh water, as defined by measured total dissolved solids, throughout the Edwards aquifer section to total depth of the well. Analyses of the water samples obtained from different depths indicate fairly uniform quality, with the highest TDS values occurring in the uppermost zone tested. This suggests that any wells drilled in this area should drill at least 200-250 feet of Edwards porosity to obtain good quality water. Sulfate concentration in the water can be lowered by aeration. Significance of detectable chromium found in the well will need to be further evaluated.
The South Medina County Observation Well is completed with the entire Edwards aquifer section open for future monitoring and testing. A pressure transducer is being installed to monitor hydrostatic pressure changes in the aquifer at this location. Future testing should include a pumping test conducted at a pumping rate far in excess of 300 gal/min in order to produce measurable drawdown and subsequent recovery. Water quality samples should be obtained on a quarterly to semi-annual basis to evaluate changes in quality as aquifer levels fluctuate. If water quality changes are noted, discrete intervals should be sampled in the well.
The final conclusion of this project is that the freshwater/ saline-water interface in this portion of the Edwards aquifer is located to the south of the South Medina County Observation Well. Refinement of the calculated data from Report 92-03, utilizing measured versus calculated data from this project, should better define the interface in western Medina and Frio counties. The data and conclusions will also be forwarded to the Texas Natural Resources Conservation Commission with the recommendation that the position of the freshwater/saline-water interface should be re-evaluated in light of the new data made available by this project.
Drilling, Construction and Testing of Monitor Wells for the Edwards Aquifer Bad Water Line Experiment
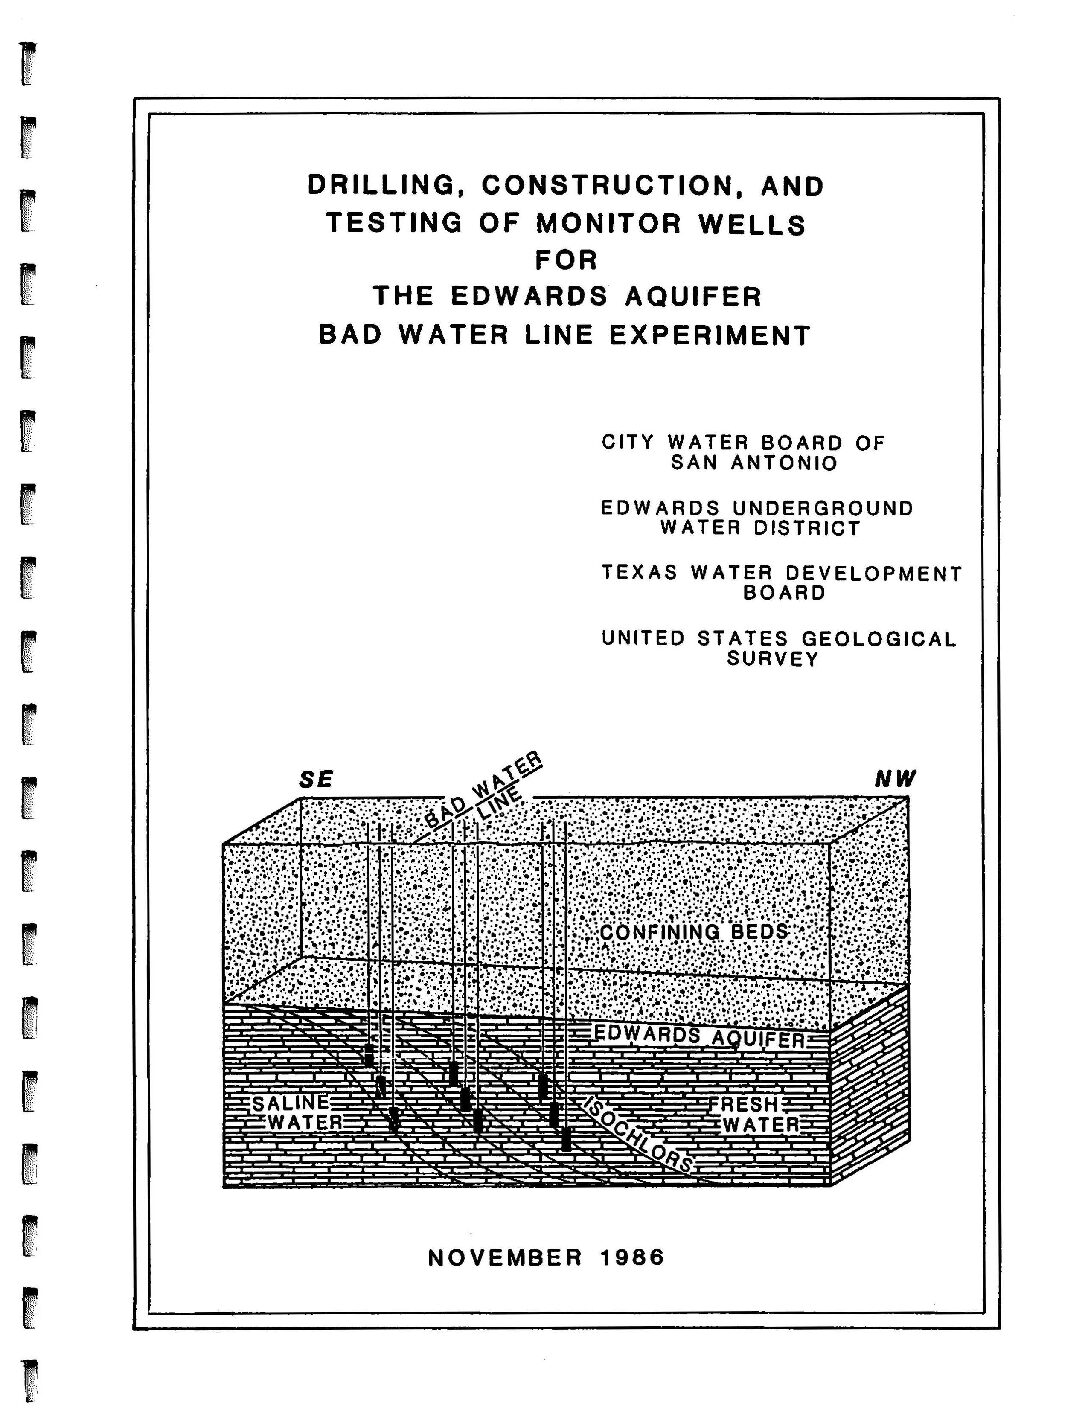
Description: Study of the fresh water-saline interface using new monitoring wells in the San Antonio Artesia Water Field. Note: This report is included for its historical value and may no longer reflect current conditions.
Location: Edwards Aquifer, Balcones Fault Zone, San Antonio Segment, Artesia Well Field
Summary:Note: This report is included for its historical value and may no longer reflect current conditions.
The primary purpose for the Edwards aquifer bad water line experiment is to establish a long-term monitoring system and develop site-specific information at one location along the bad water line. Ongoing analysis of information obtained as a result of this project is expected to help in determining whether encroachment of poor quality water presents a serious problem to maximum use of the aquifer as natural and man-made stresses of the aquifer come to pass, and in determining ways to avoid the problem to the extent it exists.
This report discusses the drilling, construction, and testing of monitor wells along a transect of the Edwards aquifer bad water line and the data that were obtained during those operations. The transect is the first of a number of similar transects that are planned for various locations along the bad water line of the Edwards aquifer in the San Antonio region. It is located near the City Water Board of San Antonio's Artesia Well Field in the eastern part of San Antonio, Texas.
Seven monitor wells were constructed during this part of the Edwards aquifer bad water line experiment. The wells are completed at different depths in the Edwards aquifer at three sites along the transect. Three wells are located at the bad-water zone site, the southernmost site, two are located at the transition-zone site, and two are located at the fresh-water zone site, which is adjacent to the Artesia Well Field and a little more than a mile north-northwest of the bad-water zone site.
The U.S. Geological Survey through a cooperative program with the City Water Board and the Edwards Underground Water District is currently making a more detailed analysis of conditions along the transect. This analysis will include microscopic examination of drill cutting samples and detailed study of geophysical logs, bore hole surveys, and geochemistry. Long-term monitoring of water levels and water quality will provide information for determining whether the bad water line shifts as a result of stresses imposed on the aquifer, and if so, how this is likely to affect the availability of fresh ground water.
In view of the presence of poor quality water in the lower part of the Edwards aquifer at the northernmost drilling site, it will be desirable to extend the transect northward into and beyond the Artesia Well Field to find out if poor quality water is present in the lower part of the aquifer in a much larger part of the area. Construction of additional monitor well transects of the Edwards aquifer bad water line will be needed in other areas to better establish how conditions along the bad water line are likely to affect the availability of fresh ground water from the aquifer on a regional basis.
Consideration needs to be given to constructing a transect of the bad water line in the New Braunfels or San Marcos areas to the north, and another one in the D'Hanis or Uvalde areas to the west. The bad water line in the areas to the north may be related to faulting, whereas in the areas to the west, it may be related to rock permeabilities. These areas are in or near major groundwater flow paths. Therefore, the information obtained from these transects also will contribute to a better understanding of regional hydrology.
Geochemical and Isotopic Analyses of Waters Associated with the Edwards Limestone Aquifer, Central Texas
Description: Inorganic chemical analyses of various Edwards Aquifer samples circa 1976 using new field methods
Location: Edwards Aquifer, Balcones Fault Zone, San Antonio Segment
Summary:The results of analyses of 14 common chemical species dissolved in 92 samples of waters associated with the Edwards Limestone aquifer are tabulated. Additional analyses for stable carbon and radiocarbon and stable sulfur isotopes on 34 of these samples are also tabulated. Field collection and field and laboratory analytical techniques were designed to make these analyses useful for geochemical studies. Edwards waters can be grouped into five chemical types recharge, main fresh water, varied, and two types of transitional and saline waters. All types are saturated with calcite and all transitional and saline waters are saturated with dolomite as well. Some saline samples are also saturated with gypsum, celestite, strontianite, and fluorite .
File Memorandum on Review of Water Quality Changes in Edwards Reservoir-Especially Near the Bad Water Line
Description: File memorandum on review of water quality from monitoring wells near the bad water line through 1967 Note: Page-size and large-format size of original plate are at the end of the document.
Location: Edwards Aquifer, Balcones Fault Zone, San Antonio Segment
Summary:This memorandum presents the results of a review of the water quality data for the observation wells through 1967. It also includes some observations on the general water quality of the Edwards. The primary purpose of reviewing the water quality observation well data has been to identify where
and when changes in water quality have occurred and the nature of the changes.
PRINCIPAL CONCLUSIONS AND RECOMMENDATIONS
1. The water quality changes in individual wells have to date mostly been small. No large, lateral shift in the position of the bad water line is apparent from the data available, and none is believed to
have occurred in historical times.
2.. The present study indicates that there are considerably more wells in which water quality variations occur than have been recognized, or were recognizable, in the past. This is probably
due mostly to a longer period of record now being available for some of the wells over periods when larger and more prolonged changes in stage of the reservoir have occurred.
3. Wells located very close to the bad water line tend to show larger and more easily recognizable changes in quality than other wells, but some changes in water quality are noted for wells located
some distance both north and south of the bad water line.
4. It does not appear that a more exhaustive study of the bad water line is warranted at present, but additions to the present network of wells sampled, particularly in Bexar County, appear to be
warranted.
Because of the potential importance to San Antonio of quality changes along the bad water line in Bexar County and inasmuch as quite a few small changes are apparently occurring, it is recommended that additional wells both along the bad water line and south of the bad water line be included in the semi-annual sampling program of the USGS cooperative study. Table 5 lists all the wells in Bexar and Atascosa Counties that we recommend be in the program.
Some of those listed are already a part of the program, and nearly all have been included at one time or another. Each well should be sampled each year in January and August and a preliminary
type analysis made. In addition, a search for additional, existing wells in Bexar County located both close to the bad water line and also south of the bad water line should be made, and probably all
wells found should be added to the program.
Using Geophysical Logs in the Edwards Aquifer to Estimate Water Quality Along the Freshwater/Saline-Water Interface (Uvalde to San Antonio, Texas)
Description: Note: Large-format versions of the plates for this report are available in a companion document. Analysis of geophysical logs and well data to redefine the boundary of the freshwater/saline interface in the Edwards Aquifer Balcones Fault Zone San Antonio Segment.
Report Number: 92-03
Location: Edwards Aquifer, Balcones Fault Zone, San Antonio Segment, Freshwater/Saline Interface, Uvalde to San Antonio, TX
Summary:Note: Large-format versions of the plates for this report are available in a companion document.
Over one hundred geophysical logs from locations near the freshwater/saline-water interface of the Edwards aquifer between Uvalde and San Antonio, Texas, were acquired and analyzed. In conjunction with these logs, test data from several wells along the interface in San Antonio and to the northeast were used to verify a high correlation between estimated and measured water quality parameters. Geochemical conditions such as specific conductance and dissolved solids in the freshwater/saline-water transition zone in the Edwards aquifer can be interpreted from geophysical logs.
Results of the estimated water quality data determined in this study indicate that the freshwater/saline-water interface is irregular, both vertically and horizontally, and extends downdip into Frio County in the area of the Frio-Zavala County line, contrary to the location previously estimated. Concurrently, a similar condition exists west of Devine, Texas, where the estimated position of the freshwater/saline-water interface is again downdip and farther south than has been shown in earlier studies.
Data such as rock color, information indicating lost circulation and/or caverns, and reports of freshwater on well tests supplements geophysical log-derived water quality parameter maps in supporting the concept of the occurrence of freshwater between the previous freshwater/saline-water interface and the position of the estimated freshwater/saline-water interface determined by this report.
Investigation of the Fresh/Saline Water Interface in the Edwards Aquifer in New Braunfels and San Marcos, Texas Executive Summary
Description: Attempts to define the freshwater/saline water boundary and its movement in the New Braunfels/San Marcos area from monitoring well data.
Report Number: 92-02
Location: Edwards Aquifer, Balcones Fault Zone, San Antonio Segment, New Braunfels, San Marcos
Summary:The purpose of this investigation was to develop site-specific information at selected sites along the fresh/saline-water interface and to establish a long term monitoring system. The report discusses the drilling,construction, and testing of a series of monitoring wells located in New Braunfels and San Marcos, Texas. Data collected as a result of this study will continue to provide information needed to determine whether encroachment of poor quality water presents a serious problem to maximum use of the aquifer as natural and man-made stresses on the aquifer system occur.
The conclusions to be drawn from this pump test are not definitive of saline water intrusion because the production well used was a transition well (containing both fresh and saline waters). However, an increase in salinity in the production well could indicate that the interface between the fresh/saline zones moved. This is supported by a low sloping cone of depression during the pump test combined with the ability of water to flow from the saline zone to this transitional well. However, the well must have also drawn fresh water to it, for the salinity values did not increase to the same values observed in the saline zone. Nevertheless, the data suggests that an element of caution should be considered during periods of increased hydrologic stress on the aquifer system in this area.
2011 Hydrologic Data Fact Sheet for Precipitation, Groundwater Levels and Drought Conditions
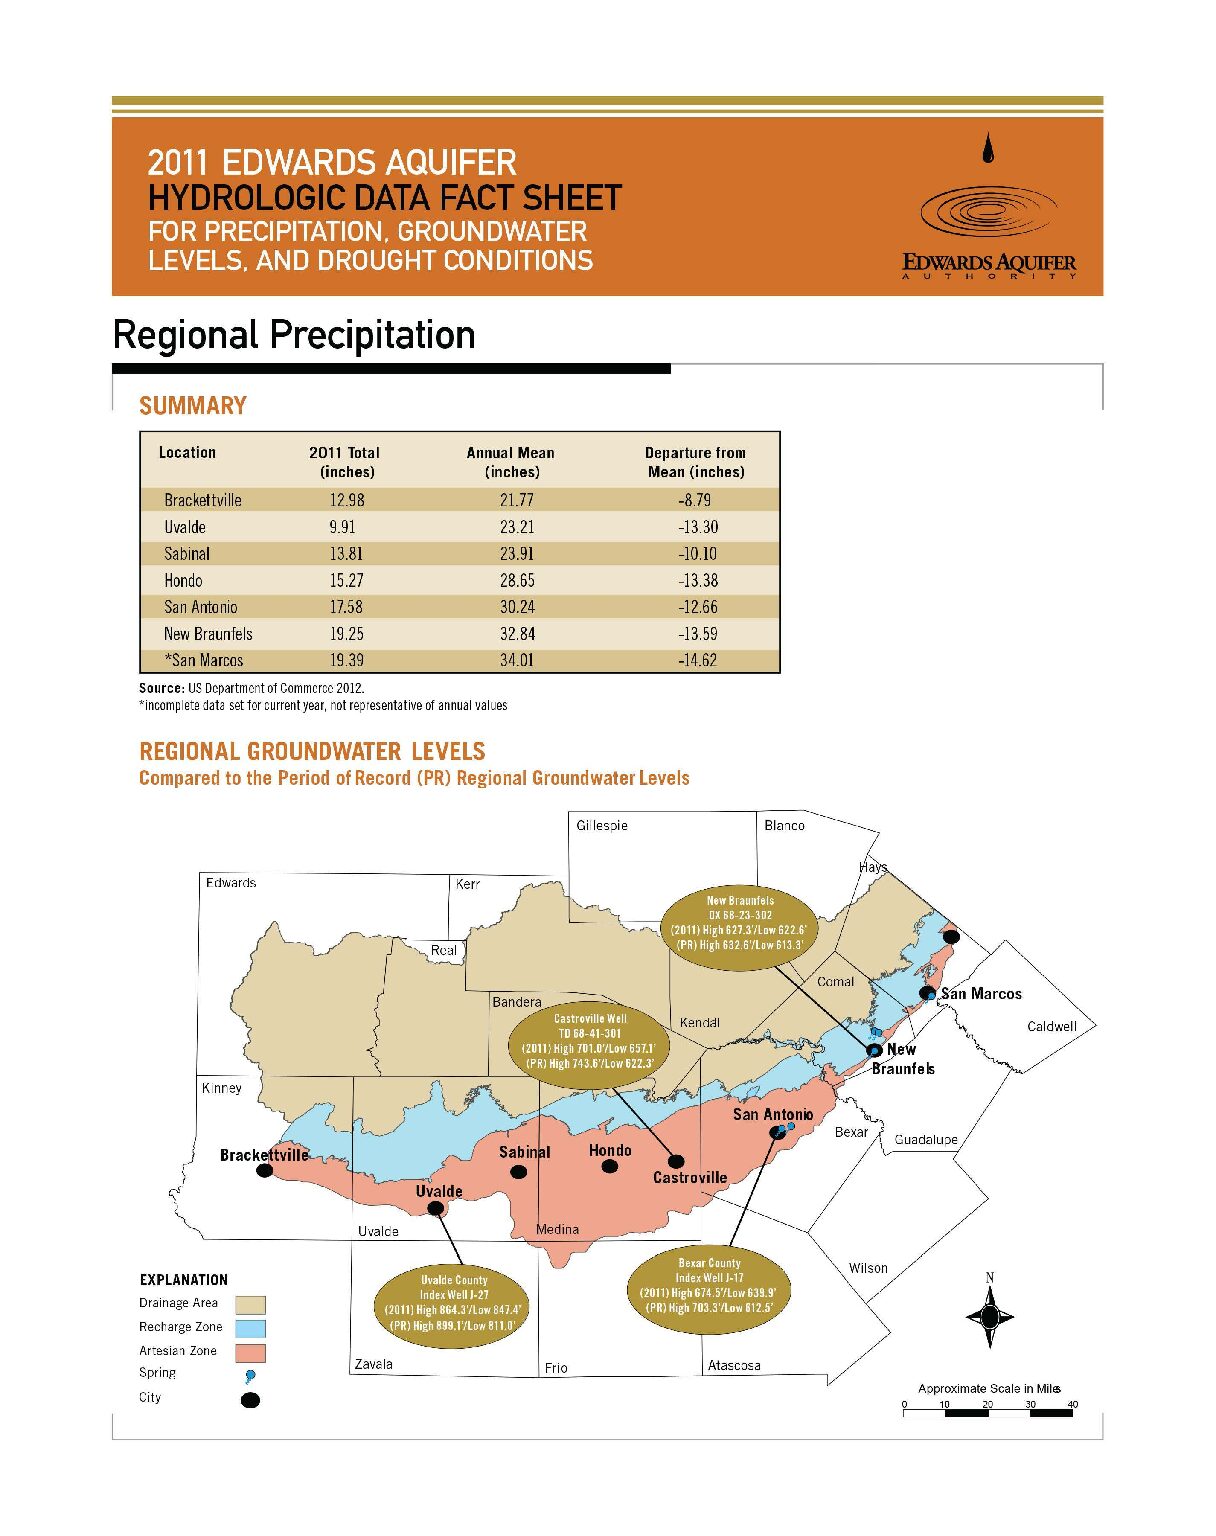
Description: Summary for 2011 on precipitation, groundwater levels, and drought in the Edwards Aquifer San Antonio Region
Location: Edwards Aquifer - San Antonio Area
Summary:Each year, the Edwards Aquifer Authority (Authority) publishes a comprehensive Hydrologic Data Report offering an extensive compilation of data on the Edwards Aquifer. This fact sheet is a sampling of the information that can be found in that report.
1994 Review and Update of the Position of the Edwards Aquifer Freshwater/Saline-Water Interface from Uvalde to Kyle, Texas
Description: 1994 attempt to describe the location of the freshwater/saline-water interface accurately from Kyle to Uvalde, Texas
Report Number: 94-05
Location: Edwards Aquifer Balcones Fault Zone San Antonio Segment, Freshwater/Saline-Water Interface, Kyle, Lytle, Medina County, Uvalde
Summary:This report is the latest attempt to accurately describe the location of the freshwater/saline-water interface from Kyle to Uvalde, Texas. Multiple sources were used to obtain high quality measured specific conductance and total dissolved solids values. All comparisons relating specific conductance to total dissolved solids have shown a high degree of correlation in every area near the interface. Total dissolved solids estimates derived from quantitative geophysical log recordings agree well with actual measurements taken in the same boreholes. The practical use of merged, measured, and calculated data is demonstrated along the interface from Kyle to Lytle. where abundant measured data is observed to be sufficiently distributed among map values generated from geophysical logs. As a result, the revised interface closely parallels former estimates. The changes are dictated by added control and, to a minor degree, by the contour options on the part of the various investigators.
The area from Lytle to Uvalde is lacking an abundant supply of TDS measurements. Therefore, reliance upon TDS estimates obtained from quantitative geophysical log interpretations is necessary. This is especially true in southern Medina County. To verify the major difference between the interface location presented in EUWD Report 92-03, EUWD South Medina Observation Well #I was drilled. This well proved that freshwater was at least three miles south of the commonly accepted freshwater/saline-water interface. This test well data and other additional geophysical logs were used to enhance the TDS and specific conductance maps furnished in EUWD Report 92-03. The TDS map shown in EUWD Report 93-06 has been merged with the TDS map shown in this report (Lytle to Uvalde) to provide the most current interpretation of the freshwater/ saline-water interface position from Kyle to Uvalde, Texas. Accuracy of the interface position west of Lytle is not as sound as that shown for the area east extending to Kyle, Texas. To more precisely determine the freshwater/saline-water interface location between Lytle and Uvalde, acquisition of measured well data, which may have been overlooked in the past, and drilling of additional observation wells will be required. The position of these new wells will be dependent upon the area where the most critical information is required.
Defining the Edwards Aquifer Freshwater/Saline-Water Interface with Geophysical Logs and Measured Data (San Antonio to Kyle, Texas)
Description: Analysis of geophysical logs to define the freshwater/saline water interface in the Edwards Aquifer between San Antonio and Kyle, TX. Note: Large-format versions of the plates for this report are available in a companion document.
Report Number: 93-06
Location: Freshwater/Saline Interface, San Antonio to Kyle
Summary:Note: Large-format versions of the plates for this report are available in a companion document.
One hundred twenty six geophysical logs from locations near and downdip from the current Edwards aquifer freshwater/saline-water interface between San Antonio and Kyle, Texas, were acquired and analyzed. Measured water quality data was obtained from eighty-one water samples taken from wells within the study area. Twenty wells possessed both usable geophysical logs and measured data which were used together to verify a high correlation between estimated and measured water quality parameters. This study and Edwards Underground Water District (EUWD) Reports 92-02 and 92-03 establish good agreement between calculated and measured values of specific conductance and measured and estimated values of total dissolved solids within the study area and near the freshwater/saline-water interface between Uvalde and Kyle, Texas.
The location of the freshwater/saline-water interface derived from this study closely parallels data published by the EUWD, such as EUWD Bulletin 51 (1992), but indicates that there is slightly less area occupied by freshwater than previously shown. Maps presented in this report can be used to infer additional water quality characteristics near the interface such as rate of change of total dissolved solids, concentrations of highly mineralized water, zones of dilution downdip and indications of freshwater flow patterns.
This study suggests that a very large area of moderately saline water exists in eastern Bexar County and western Guadalupe County. The transition from moderately saline water to brine is very rapid near the common corner of Bexar, Atascosa, and Wilson counties. The large area of moderately saline water changes to water containing higher total dissolved solids northward from Guadalupe County toward the San Marcos River. A re-entrant of very saline water, which is subparallel to the San Marcos River, terminates the moderately saline zone in Guadalupe County, extends to the northwest, and is present in the City of San Marcos.
2010 Edwards Aquifer Hydrologic Data Fact Sheet for Precipitation, Groundwater Levels and Drought Conditions
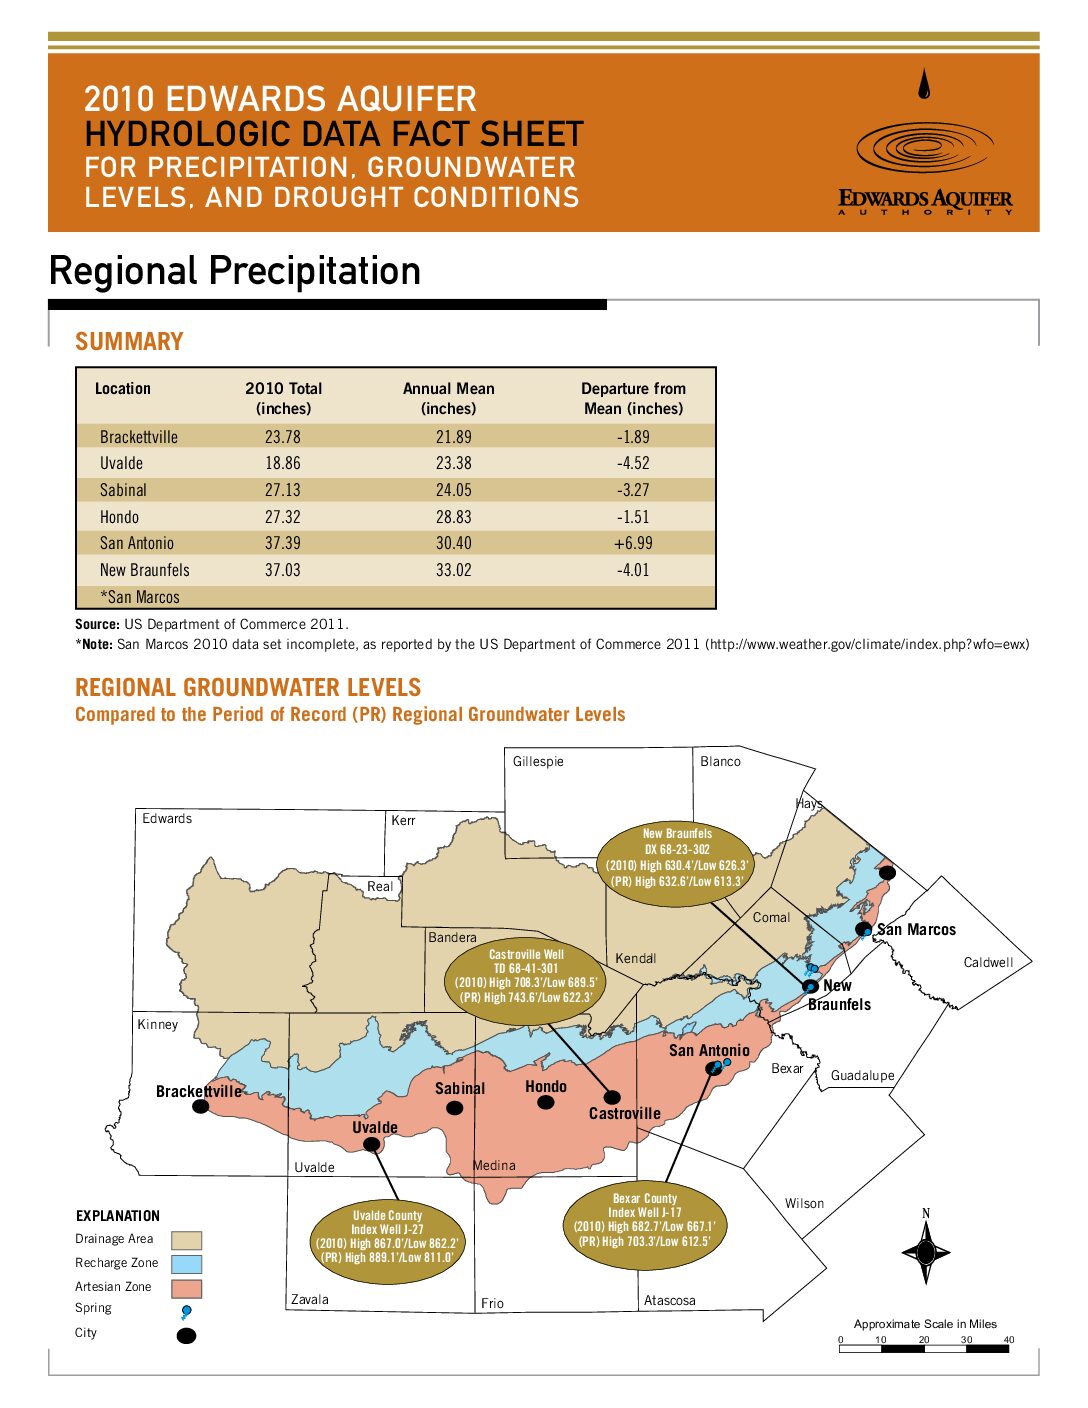
Description: Summary for 2010 on precipitation, groundwater levels, and drought in the Edwards Aquifer San Antonio Region
Location: Edwards Aquifer - Balcones Fault Zone - San Antonio Segment
Summary:Each year, the Edwards Aquifer Authority (Authority) publishes a comprehensive Hydrologic Data Report offering an extensive compilation of data on the Edwards Aquifer. This fact sheet is a sampling of the information that can be found in that report.


